Active IQ Digital Advisor
 Suggest changes
NetApp Active IQ Digital Advisor (also known as Digital Advisor) provides a series of visualizations, analytics, and other support-related services to NetApp customers for their hardware / software systems. The data reported by Digital Advisor can enhance troubleshooting of system problems and also provide insight into optimization and predictive analysis related to your devices.
Data Infrastructure Insights collects the Risks for any NetApp Clustered Data ONTAP storage system that is monitored and reported by Digital Advisor. Risks reported for the storage systems are collected automatically by Data Infrastructure Insights as part of its data collection from those devices. You must add the appropriate data collector to Data Infrastructure Insights to collect Digital Advisor risk information.
Data Infrastructure Insights will not show risk data for ONTAP systems that are not monitored and reported by Digital Advisor.
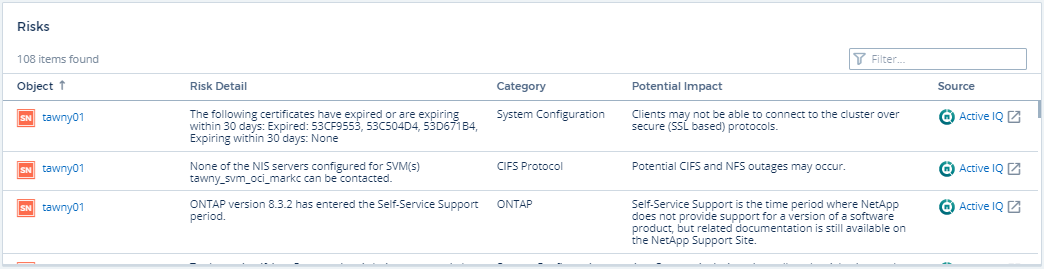
The risks reported are shown in Data Infrastructure Insights on the storage and storage node asset landing pages, in the "Risks" table. The table shows Risk Detail, Category of risk, and Potential Impact of the risk, and also provides a link to the Digital Advisor page summarizing all risks for the storage node (NetApp Support account sign-in required).
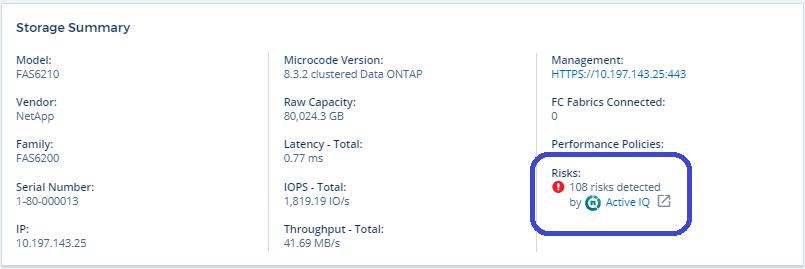
A count of reported risks is also shown in the landing page's Summary widget, with a link to the appropriate Digital Advisor page. On a storage landing page, the count is a sum of risks from all underlying storage nodes.
Opening the Digital Advisor page
When clicking on the link to an Digital Advisor page, if you are not currently signed in to your Digital Advisor account, you must perform the following steps to view the Digital Advisor page for the storage node.
-
In the Data Infrastructure Insights Summary widget or Risks table, click the "Digital Advisor' link.
-
Sign in to your NetApp Support account. You are taken directly to the storage node page in Digital Advisor.
Querying for Risks
In Data Infrastructure Insights, you can add the monitoring.count column to a storage or storage node query. If the returned result includes Digital Advisor-Monitored storage systems, the monitoring.count column will display the number of risks for the storage system or node.
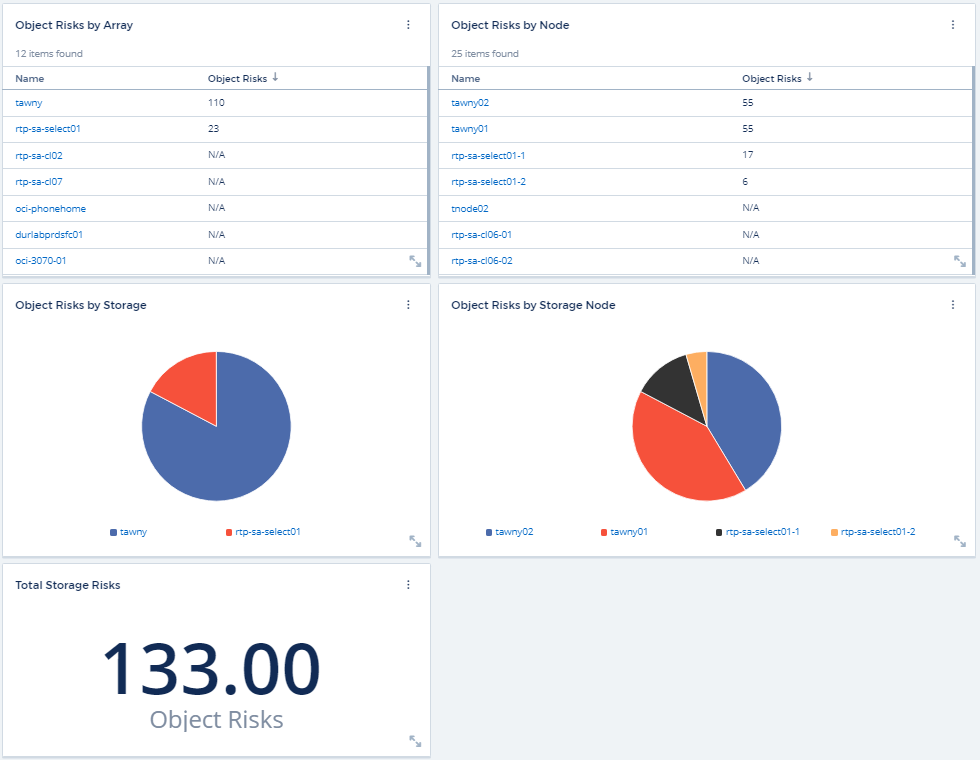
Dashboards
You can build widgets (e.g. pie chart, table widget, bar, column, scatter plot, and single value widgets) in order to visualize object risks for storage and storage nodes for NetApp Clustered Data ONTAP systems monitored by Digital Advisor. "Object Risks" can be selected as a column or metric in these widgets where Storage or Storage Node is the object of focus.