

Data Retention and Downsampled Data
 Suggest changes
Data Infrastructure Insights retains data for periods ranging from 7 days to 13 months depending on your subscription. When displaying large datasets, data may be downsampled to ensure charts and graphs load efficiently while maintaining statistical accuracy.
Data Retention
Data Infrastructure Insights retains data for an amount of time determined by your subscription type.
| Subscription Type | Data Retention |
|---|---|
Trial |
7 Days |
Subscribed |
13 Months |
For detailed information about Data Infrastructure Insights features and pricing options, see the Data Infrastructure Insights Pricing page.
Downsampling of Data
Downsampling provides a statistical approximation of your data in charts, giving you an efficient overview of data without having to display every data point, while maintaining an accurate view of your collected data.
Why is downsampling needed?
Because a large amount of processing is needed to prepare data for display in charts and graphs, in order to allow charts to display quickly and efficiently, data may be downsampled in a manner that keeps the overall shape of a chart without needing to process every single data point for that chart.
Note: No actual data is lost during downsampling. You can choose to view actual data for your chart instead of downsampled data by following the steps illustrated below.
How downsampling works
Data is downsampled under the following conditions:
-
When your selected time range includes 7 days of data or less, no downsampling occurs. Charts display actual data.
-
When your selected time range includes more than 7 days of data but less than 1,000 data points, no downsampling occurs. Charts display actual data.
-
When your selected time range includes more than 7 days of data and more than 1,000 data points, data is downsampled. Charts display approximated data.
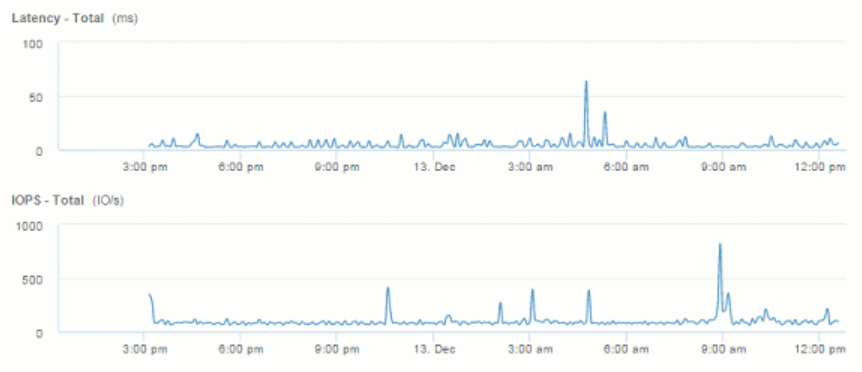
The following examples show downsampling in action. The first illustration shows latency and IOPS charts on a Datastore asset page for a 24-hour period, as shown by selecting 24h on the asset page's time selector. You can also see the same data by selecting Custom and setting the time range to the same 24-hour period.
Since we are choosing a time range of less than 7 days and we have less than 1,000 data points to chart, the data displayed is actual data. No downsampling occurs.
However, if you are viewing data by choosing either 30d on the asset page time selector, or by setting a custom time range of more than 7 days (or in the event that Data Infrastructure Insights has collected more than 1,000 data samples for the time period chosen), the data is downsampled before being displayed. When you zoom in on a downsampled chart, the display continues to show the approximated data.

|
When you zoom in on a downsampled chart, the zoom is a digital zoom. The display continues to show the approximated data. |
You can see this in the following illustration, where the time range is first set to 30d, and the chart is then zoomed in to show the same 24-hour period as above.
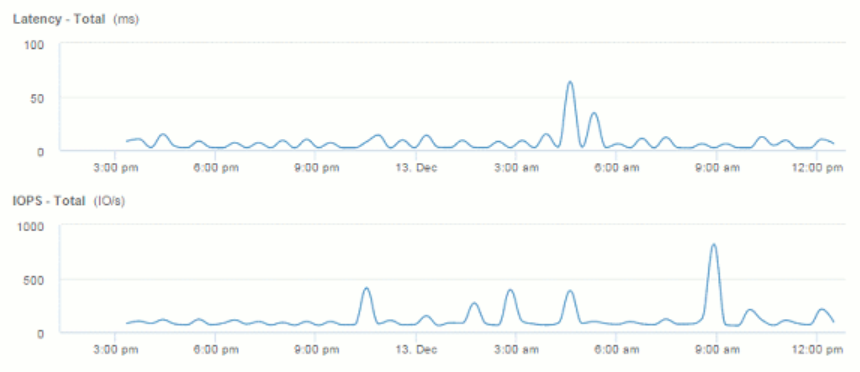
The downsampled charts are showing the same 24-hour period as the "actual" charts above, so the lines follow the same general shape, allowing you to quickly spot interesting peaks or valleys in your performance data.
|
|
Due to the way data is approximated for downsampling, chart lines may be off slightly when comparing downsampled vs. actual data, to allow for better alignment in the graphs. However, the difference is minimal and does not affect the overall accuracy of the data displayed. |
Violations on downsampled charts
When viewing downsampled charts, be aware that violations are not shown. To see violations, you can do one of two things:
-
View the actual data for that time range by selecting Custom in the asset page time selector, and entering a range of time less than 7 days. Hover over each red dot. The tooltip will show the violation that occurred.
-
Note the time range and find the violation(s) in the Violation Dashboard.