

Predefined Reports Made Easy
 Suggest changes
Data Infrastructure Insights Reporting includes predefined reports that address a number of common reporting requirements, providing critical insight that stakeholders need to make informed decisions about their storage infrastructure.

|
The Reporting feature is available in Data Infrastructure Insights Premium Edition. |
You can generate pre-defined reports from the Data Infrastructure Insights Reporting Portal, email them to other users, and even modify them. Several reports enable you to filter by device, business entity, or tier. The reporting tools use IBM Cognos as a foundation and give you many data presentation options.
The pre-defined reports show your inventory, storage capacity, chargeback, performance, storage efficiency, and cloud cost data. You can modify these pre-defined reports and save your modifications.
You can generate reports in various formats, including HTML, PDF, CSV, XML, and Excel.
Navigating to Pre-defined Reports
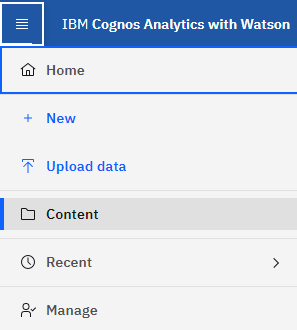
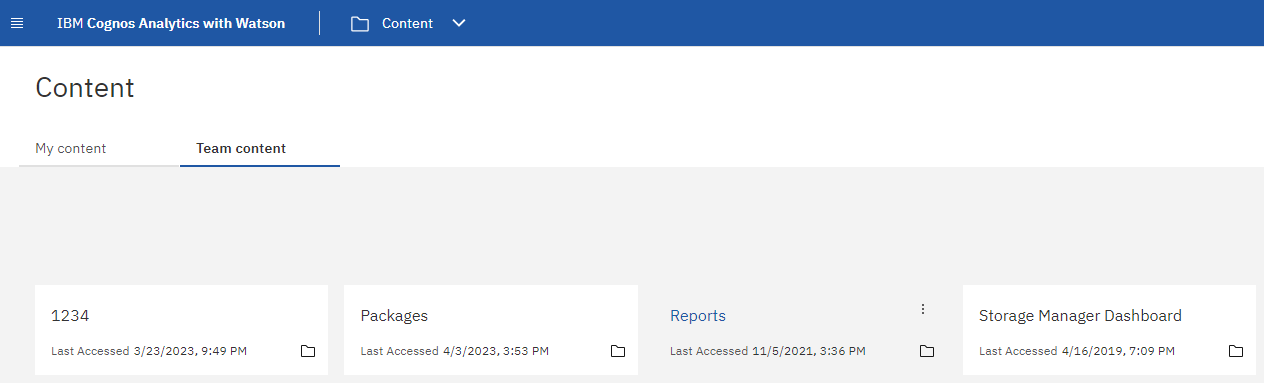
When you open the Reporting Portal, the Team Content folder is the starting point for you to select the type of information that you require in the Data Infrastructure Insights reports.
-
In the left navigation pane, select Content > Team Content.
-
Select Reports to access the pre-defined reports.
Using predefined reports to answer common questions
The following predefined reports are available in Team content > Reports.
Application Service Level Capacity and Performance
The Application Service Level Capacity and Performance report provides a high level overview of your applications. You can use this information for capacity planning or for a migration plan.
Chargeback
The Chargeback report provides storage capacity chargeback and accountability information by hosts, application, and business entities, and includes both current and historical data.
To prevent double counting do not include ESX servers, only monitor the VMs.
Data Sources
The Data Sources report shows all the data sources that are installed on your site, the status of the data source (success/failure), and status messages. The report provides information about where to start troubleshooting data sources. Failed data sources impact the accuracy of reporting and the general usability of the product.
ESX vs VM Performance
The ESX vs VM Performance report provides a comparison of ESX servers and VMs, showing average and peak IOPs, throughput, and latency and utilizations for ESX servers and VMs. To prevent double counting, exclude the ESX servers; only include the VMs.
An updated version of this report is available at the NetApp Storage Automation Store.
Fabric Summary
The Fabric Summary report identifies switches and switch information, including port counts, firmware versions, and license status. The report does not include NPV switch ports.
Host HBAs
The Host HBAs report provides an overview of the hosts in the environment and provides the vendor, model, and firmware version of HBAs, and the firmware level of the switches to which they are connected. This report can be used to analyze firmware compatibility when planning a firmware upgrade for a switch or an HBA.
Host Service Level Capacity and Performance
The Host Service Level Capacity and Performance report provides an overview of storage utilization by host for block only applications.
Host Summary
The Host Summary report provides an overview of storage utilization by each selected host with information for Fibre Channel and iSCSI hosts. The report enables you to compare ports and paths, the Fibre Channel and ISCSI capacity, and violation counts.
License Details
The License Details report shows the entitled quantity of resources you are licensed for across all sites with active licenses. The report also shows a summation of actual quantity across all the sites with active licenses. The summation may include overlaps of storage arrays managed by multiple servers.
Mapped but not Masked Volumes
The Mapped but not Masked Volumes report lists the volumes whose logical unit number (LUN) has been mapped for use by a particular host, but is not masked to that host. In some cases these could be decommissioned LUNs that have been unmasked. Unmasked volumes can be accessed by any host, making them vulnerable to data corruption.
NetApp Capacity and Performance
The NetApp Capacity and Performance report provides global data for allocated, utilized, and committed capacity with trending and performance data for NetApp capacity.
Scorecard
The Scorecard report provides a summary and general status of all assets acquired by Data Infrastructure Insights. Status is indicated with green, yellow, and red flags:
-
Green indicates normal condition
-
Yellow indicates a potential issue in the environment
-
Red indicates an issue that requires attention
All of the fields in the report are described in the Data Dictionary provided with the report.
Storage Summary
The Storage Summary report provides a global summary of used and unused capacity data for raw, allocated, storage pools, and volumes. This report provides an overview of all of the storage discovered.
VM Capacity and Performance
Describes the virtual machine (VM) environment and its capacity usage. VM tools must be enabled to view some data, such as when VMs were powered down.
VM Paths
The VM Paths report provides data store capacity data and performance metrics for which virtual machine is running on which host, which hosts are accessing which shared volumes, what the active access path is, and what comprises capacity allocation and usage.
HDS Capacity by Thin Pool
The HDS Capacity by Thin Pool report shows the amount of usable capacity on a storage pool that is thin provisioned.
NetApp Capacity by Aggregate
The NetApp Capacity by Aggregate report shows raw total, total, used, available, and committed space of aggregates.
Symmetrix Capacity by Thick Array
The Symmetrix Capacity by Thick Array report shows raw capacity, useable capacity, free capacity, mapped, masked, and total free capacity.
Symmetrix Capacity by Thin Pool
The Symmetrix Capacity by Thin Pool report shows raw capacity, useable capacity, used capacity, free capacity, used percentage, subscribed capacity, and subscription rate.
XIV Capacity by Array
The XIV Capacity by Array report shows used and unused capacity for the array.
XIV Capacity by Pool
The XIV Capacity by Pool report shows used and unused capacity for storage pools.