Auditing
 Suggest changes


To identify changes both expected (for tracking) or unexpected (for troubleshooting), you can view an audit trail of the Data Infrastructure Insights system events and user activities.
Viewing Audited Events
To View the Audit page, click Admin > Audit in the menu. The Audit page is displayed, providing the following details for each audit entry:
-
Time - Date and time of the event or activity
-
User - The User who initiated the activity
-
Role - The user's role in Data Infrastructure Insights (guest, user, administrator)
-
IP - The IP address associated with the event
-
Action - Type of activity, for example Login, Create, Update
-
Category - The category of activity
-
Details - Details of the activity
Displaying audit entries
There are a number of different ways to view audit entries:
-
You can display audit entries by choosing a particular time period (1 hour, 24 hours, 3 days, etc.).
-
You can change the sort order of entries to either ascending (up arrow) or descending (down arrow) by clicking the arrow in the column header.
By default, the table displays the entries in descending time order.
-
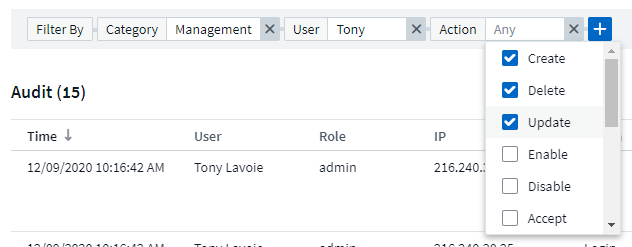
You can use the filter fields to show only the entries you want in the table. Click the [+] button to add additional filters.

More on Filtering
You can use any of the following to refine your filter:
Filter |
What it does |
Example |
Result |
* (Asterisk) |
enables you to search for everything |
vol*rhel |
returns all resources that start with "vol" and end with "rhel" |
? (question mark) |
enables you to search for a specific number of characters |
BOS-PRD??-S12 |
returns BOS-PRD12-S12, BOS-PRD23-S12, and so on |
OR |
enables you to specify multiple entities |
FAS2240 OR CX600 OR FAS3270 |
returns any of FAS2440, CX600, or FAS3270 |
NOT |
allows you to exclude text from the search results |
NOT EMC* |
returns everything that does not start with "EMC" |
None |
searches for blank/NULL/None in any field where selected |
None |
returns results where the target field is not empty |
Not * |
as with None above, but you can also use this form to search for NULL values in text-only fields |
Not * |
returns results where the target field is not empty. |
"" |
searches for an exact match |
"NetApp*" |
returns results containing the exact literal string NetApp* |
If you enclose a filter string in double quotes, Insight treats everything between the first and last quote as an exact match. Any special characters or operators inside the quotes will be treated as literals. For example, filtering for "*" will return results that are a literal asterisk; the asterisk will not be treated as a wildcard in this case. The operators OR and NOT will also be treated as literal strings when enclosed in double quotes.
Audited Events and Actions
The events and actions audited by Data Infrastructure Insights can be categorized in the following broad areas:
-
User account: Log in, log out, role change, etc.
-
Acquisition Unit: create, delete, etc.
Example: Acquisition unit AU-Boston-1 removed.
-
Data Collector: add, remove, modify, postpone/resume, change acquisition unit, start/stop, etc.
Example: Datasource FlexPod Lab removed, vendor NetApp, model ONTAP Data Management Software, ip 192.168.106.5.
-
Application: add, assign to object, remove, etc.
Example: Internal Volume ocisedev:t1appSVM01:t1appFlexVol01 added to application Test App.
-
Annotation: add, assign, remove, annotation rule actions, annotation value changes, etc.
Example: Annotation value Boston added to annotation type SalesOffice.
-
Query: add, remove, etc.
Example: Query TL Sales Query is added.
-
Monitor: add, remove, etc.
Example: Monitor Aggr Size - CI Alerts Notifications Dev updated
-
Notification: change email, etc.
Example: Recipient ci-alerts-notifications-dl created
Exporting Audit Events
You can export the results of your Audit display to a .CSV file, which will allow you to analyze the data or import it into another application.
-
On the Audit page, set the desired time range and any filters you want. Data Infrastructure Insights will export only the Audit entries that match the filtering and time range you have set.
-
Click the Export button
 in the upper right of the table.
The displayed Audit events will be exported to a .CSV file, up to a maximum of 10,000 rows.
Retention of Audit Data
The amount of time Data Infrastructure Insights retains Audit data is based on your subscription:
-
Trial environments: Audit data is retained for 30 days
-
Subscribed environments: Audit data is retained for 1 year plus 1 day
Audit entries older than the retention time are automatically purged. No user interaction is needed.
Audit entries older than the retention time are automatically purged. No user interaction is needed.
Troubleshooting
Here you will find suggestions for troubleshooting problems with Audit.
Problem: |
Try this: |
I see Audit messages telling me that a monitor has been exported. |
Export of a custom monitor configuration is typically used by NetApp engineers during development and testing of new features. If you did not expect to see this message, please consider exploring the actions of the user named in the audited action or contact support. |


