

VM Analyzer Overview
 Suggest changes
With DII's VM Analyzer, managing your virtual assets becomes simpler and more efficient. This powerful tool offers end-to-end visibility, mapping dependencies from VMDK/VM to Host to Datastore to Internal Volume/Volume to Storage.
By providing an interactive topology map, VM Analyzer enables you to pinpoint issues, understand changes, and enhance comprehension of data flow. Streamline VM management and increase your visibility into virtual workloads.
Explore connections among your assets
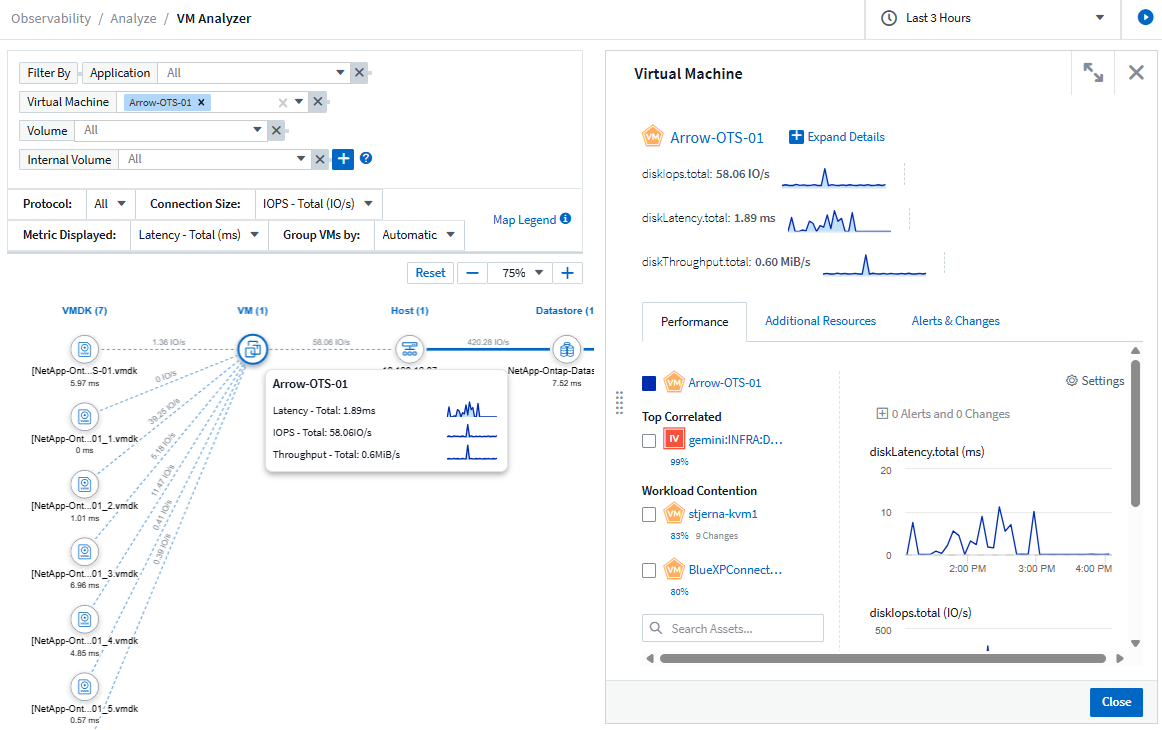
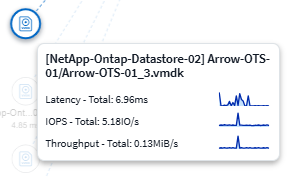
Select Observability > Analyze > VM Analyzer to view the VM Analyzer. Set a filter for Application, Virtual Machine, Volume, Internal Volume, or add your own filters. The map for the objects is displayed, showing connected objects. Hover over an object to view traffic metrics for those connections.

|
Most VM Analyzer filters (including those you may add) are contextual; when you select an object in one of these filters, the choices presented in the other filter drop-downs are refreshed in context with the selected object or objects. |
Clicking on an object or group opens a slideout panel providing additional details about the object and its connections. The slideout panel displays a summary, which provides details about the selected object (for example, throughput or utilization, depending on the type of object), and charts showing metrics for the object such as latency or IOPS. Additional tabs allow you to explore related additional resources or changes and alerts. You can select to display metrics for Top Correlated or contending objects on the charts as well, if desired.