

Monitor health of NetApp Data Classification
 Suggest changes
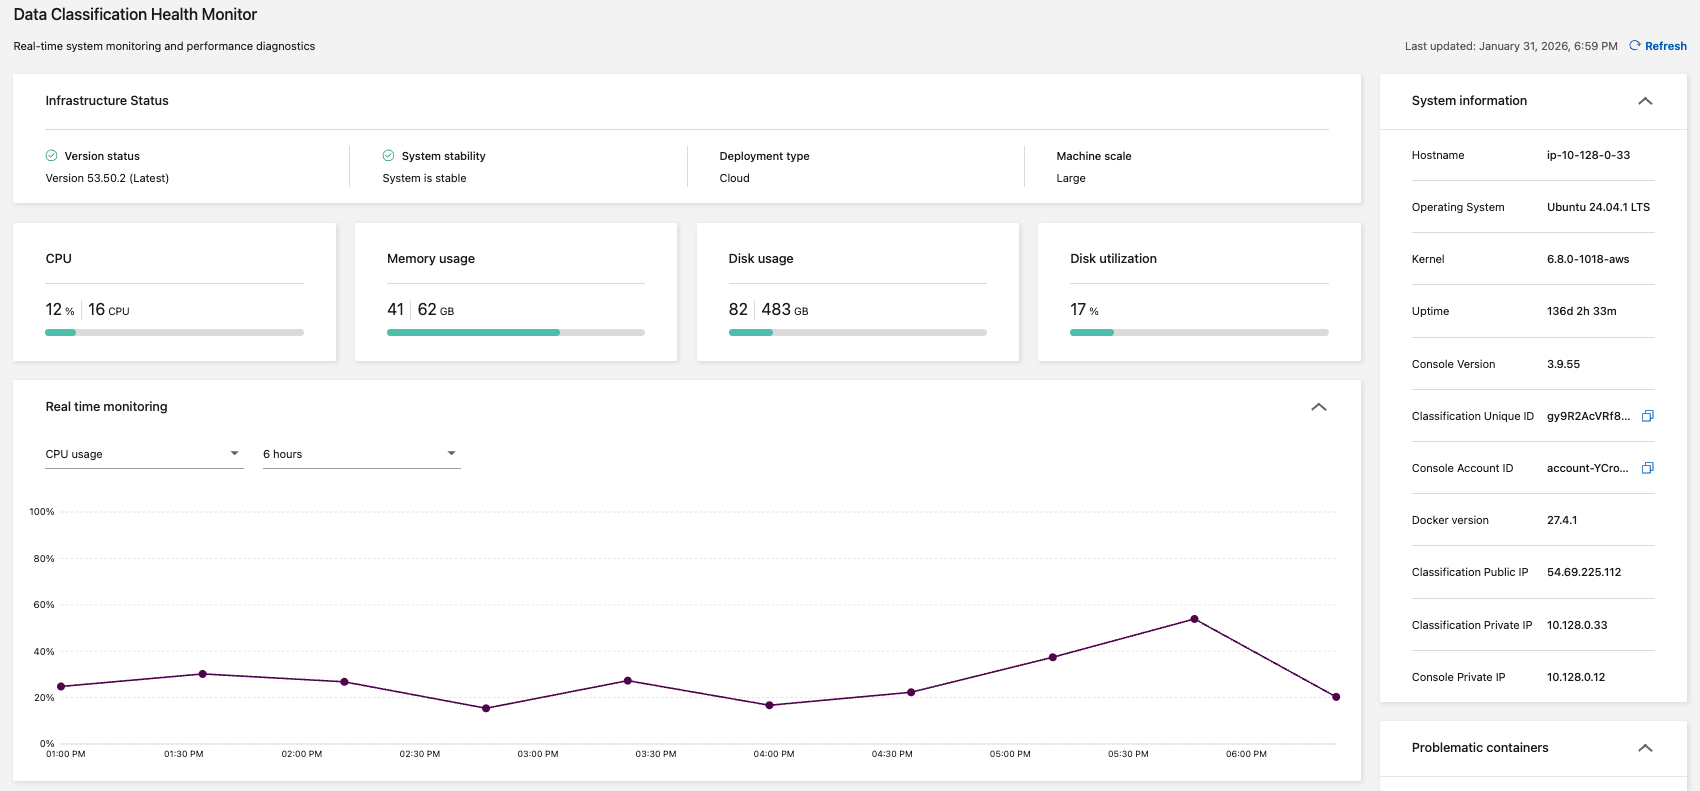
The NetApp Data Classification Health Monitor dashboard provides real-time monitoring and insights into performance. The Health Monitor captures information about your Data Classification infrastructure, system health, usage metrics, and utilization data, enabling you to identify and remediate issues.
Health Monitor insights
The Health Monitor dashboard presents information in four categories.
-
Infrastructure status
View information including the version status, system stability, deployment type, and machine scale.
-
Problematic containers
Review the problematic containers field for insights into containers that are stopped or restarting frequently. Use this information to investigate the specific containers.
-
System information
The system information panel captures critical information about the NetApp Console and Data Classification such as the public and private IP addresses, host name, operating system, Console version, and Console ID.
-
Usage and utilization
Review the CPU usage, disk utilization, disk usage, and memory usage. These values are displayed in storage units (GB) or percentages of total use. If any fields display a warning, select the warning for information and remediation recommendations.
Access the Health Monitor dashboard
-
In Data Classification, select Configuration.
-
Select the Health monitor tab.
-
In the Health Monitor dashboard, you can:
-
Review the usage and utilization. If any usage or utilization metrics display warnings, select the warning for recommendations to resolve the issue.
-
Toggle the graph to display CPU usage, disk utilization, disk usage, and memory usage. You can change the x-axis to display content over hours (6, 12, or 24) or days (2, 7, or 14).
-
Refresh the dashboard to view the most recent data metrics.
-