


View plan health and workload protection status in NetApp Disaster Recovery


 Suggest changes

 PDFs
PDFs
NetApp Disaster Recovery provides multiple ways to gain insights into workloads discovered by Disaster Recovery and the health of your sites and replication plans.
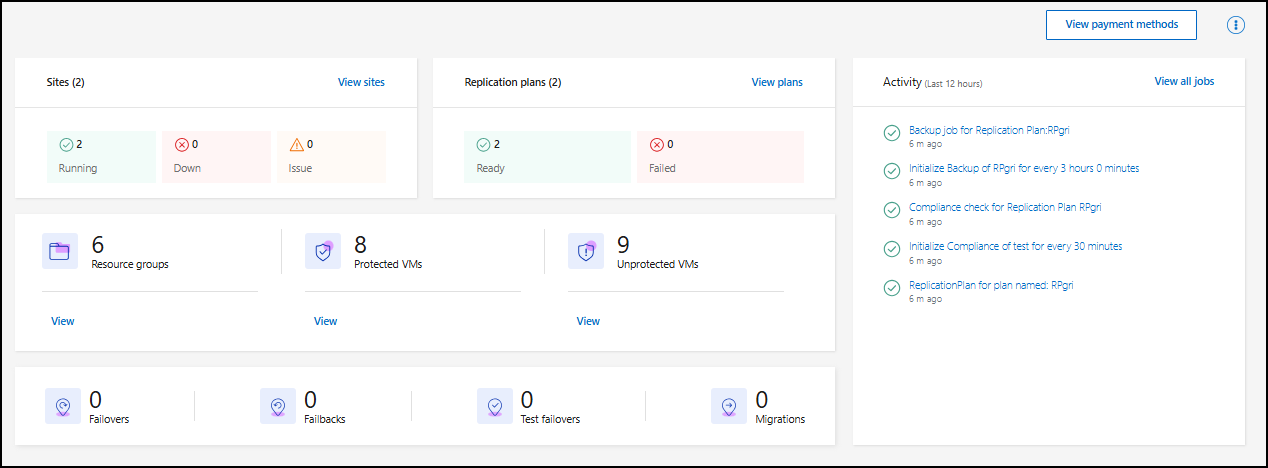
The Dashboard provides information about the health status of sites and plans, displaying a status of healthy, disconnected, or degraded. It also presents recent warnings and failed jobs. It provides an overview of capacity and protection status as well. Use the Dashboard to review health status and see an overview of your workloads.
The Workloads page provides granular listings of each VMware and Kubernetes workload discovered by Disaster Recovery. It provides information associated with the workload and its protection status. Use the Workloads page to review granular information about workloads and review protection status.
Required NetApp Console role
The Super admin, Disaster recovery admin, Disaster recovery application admin, or Disaster recovery viewer role is required to perform this task. Learn about user roles and permissions in NetApp Disaster Recovery. Learn about NetApp Console access roles for all services.
View health and protection status in the dashboard
-
From the NetApp Disaster Recovery menu, select Dashboard.
-
Review the health information in the dashboard:
-
Sites: View the health of your sites. A site can have one of the following statuses:
-
Running: The site is connected, healthy, and running.
-
Down: The site is unreachable or has connectivity issues.
-
Issue: The site is having connectivity issues.
To see details, select View all sites.
-
-
Replication plans: View the health of your plans. A plan can have one of the following statuses:
-
Ready
-
Failed
-
Warning
To review replication plan details, select View all replication plans.
-
-
-
Review Recent warnings and jobs to see the most recently executed jobs and warnings and their associated statuses. Select View all jobs to see all jobs.
-
Review the Discovery and protection status to see the number of discovered workloads and a numeric breakdown of protected versus unprotected workloads separated by type. You can also review the total discovered capacity of all workloads and workloads by type.
Review workloads' protection status
Use the Workloads page to review the protection status of individual, discovered workloads by Disaster Recovery. In addition to the protection status, Disaster Recovery shows the following information about each workload type:
| Kubernetes workloads | vCenter workloads |
|---|---|
|
|
-
From the NetApp Disaster Recovery menu, select Workloads.
-
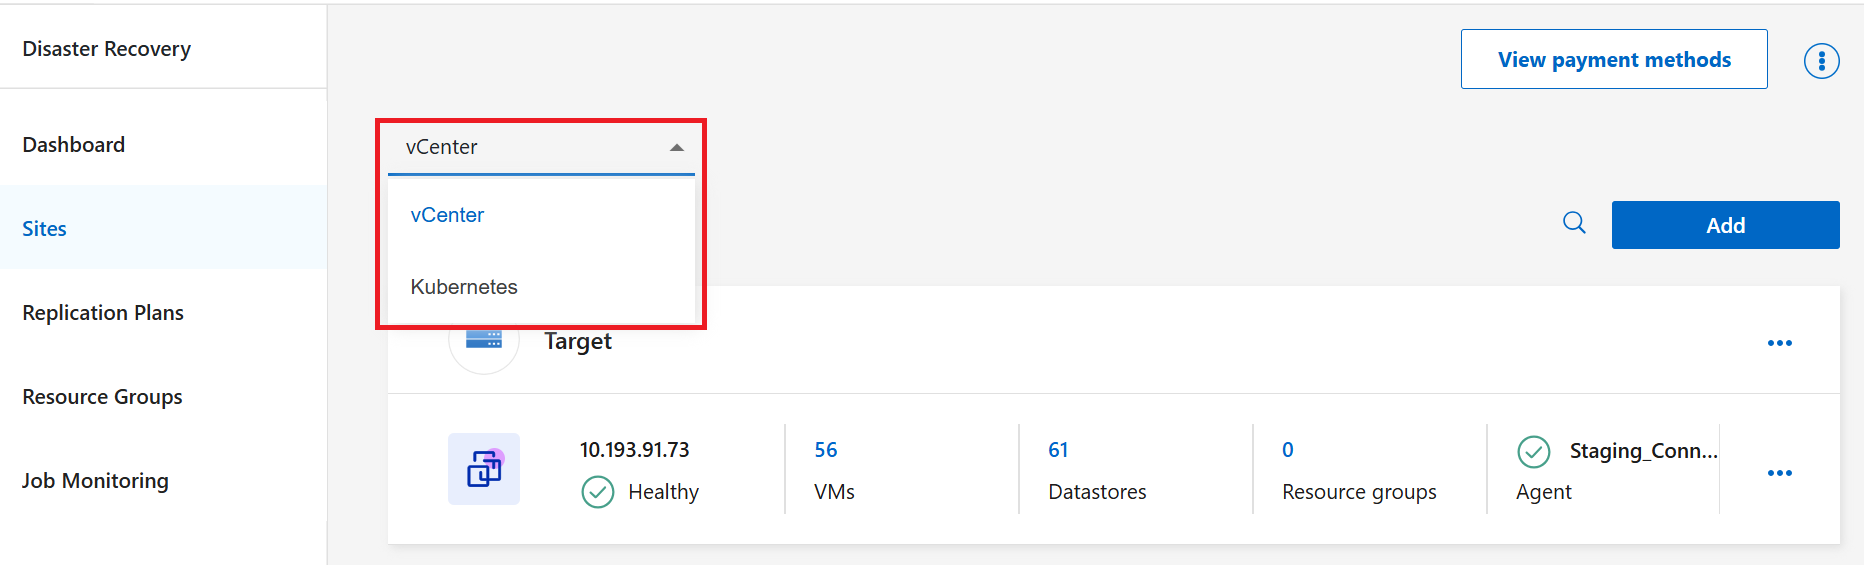
In the dropdown menu, select the filter to view either vCenter or Kubernetes workloads.
-
You can optionally search for a specific workload or filter workloads by protection status: either protected or unprotected.
-
Review the information about the workloads and protection status. Protected workloads are noted with a green checkmark. Unprotected workloads have a grey dash.