Single server load test with Login VSI
 Suggest changes


The NetApp Virtual Desktop Service uses the Microsoft Remote Desktop Protocol to access virtual desktop sessions and applications, and the Login VSI tool determines the maximum number of users that can be hosted on a specific server model. Login VSI simulates user login at specific intervals and performs user operations like opening documents, reading and composing mails, working with Excel and PowerPoint, printing documents, compressing files, and taking random breaks. It then measures response times. User response time is low when server utilization is low and increases when more user sessions are added. Login VSI determines the baseline based on initial user login sessions and it reports the maximum user session when the user response exceeds 2 seconds from the baseline.
The following table contains the hardware used for this validation.
| Model | Count | Description |
|---|---|---|
NetApp HCI H610C |
4 |
Three in a cluster for launchers, AD, DHCP, and so on. One server for load testing. |
NetApp HCI H615C |
1 |
2x24C Intel Xeon Gold 6282 @2.1GHz. 1.5TB RAM. |
The following table contains the software used for this validation.
| product | Description |
|---|---|
NetApp VDS 5.4 |
Orchestration |
VM Template Windows 2019 1809 |
Server OS for RDSH |
Login VSI |
4.1.32.1 |
VMware vSphere 6.7 Update 3 |
Hypervisor |
VMware vCenter 6.7 Update 3f |
VMware management tool |
The Login VSI test results are as follows:
| Model | VM configuration | Login VSI baseline | Login VSI Max |
|---|---|---|---|
H610C |
8 vCPU, 48GB RAM, 75GB disk, 8Q vGPU profile |
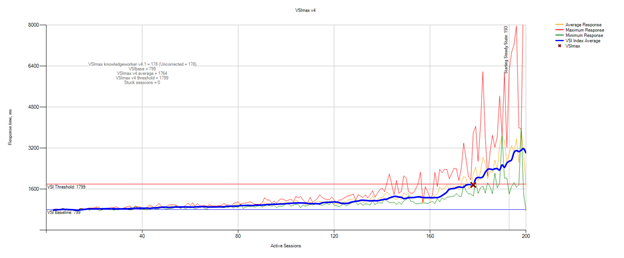
799 |
178 |
H615C |
12 vCPU, 128GB RAM, 75GB disk |
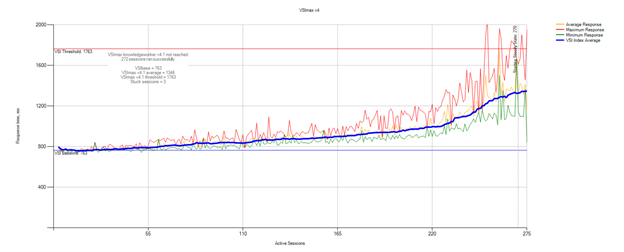
763 |
272 |
Considering sub-NUMA boundaries and hyperthreading, the eight VMs chosen for VM testing and configuration depended on the cores available on the host.
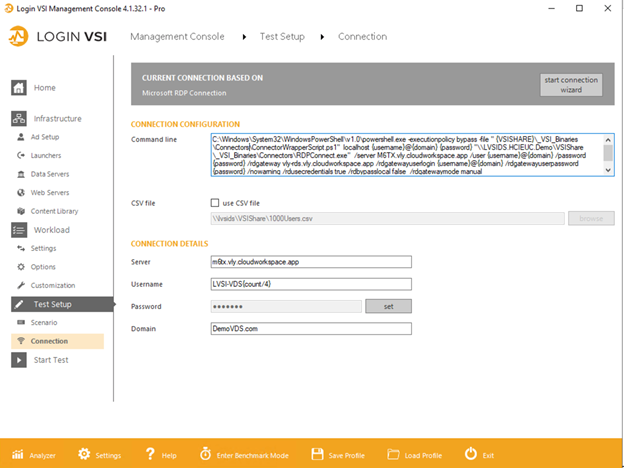
We used 10 launcher VMs on the H610C, which used the RDP protocol to connect to the user session. The following figure depicts the Login VSI connection information.

The following figure displays the Login VSI response time versus the active sessions for the H610C.

The following figure displays the Login VSI response time versus the active sessions for the H615C.

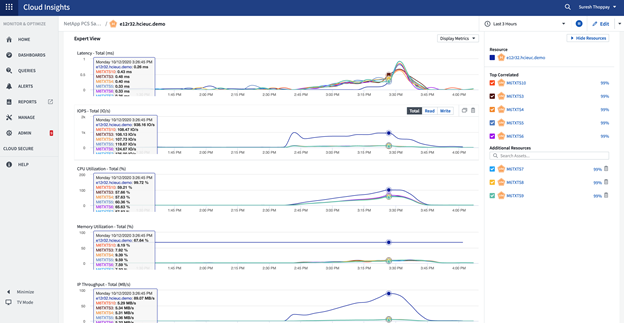
The performance metrics from Cloud Insights during H615C Login VSI testing for vSphere host and VMs is shown in teh following figure.


