

Performance validation and benchmark results
 Suggest changes
The goal of this performance validation is not to set any mark. Rather, if you follow the deployment procedures and best practices as outlined in this documentation, you can expect similar performance metrics from your Oracle database deployment in a public cloud.
We used a Swingbench Sales Order Entry (SOE) module to simulate an OLTP-type workload, and we applied the workload against an Oracle database deployed to an M5 EC2 instance with FSx storage volumes on the NFS protocol. The default Swingbench SOE I/O profile is close to a 80/20 read/write split, which is close to a real-world OLTP Oracle workload profile.
The workload is incremented by increasing the number of concurrent users on the client side that are performing sales order entry, browsing, inventory queries, and so on. The numbers tested were 8, 16, 32, 64, and 128 concurrent users. The algorithm Swingbench uses is heavy at the server side to push reasonable transaction volumes and test Oracle server limits. We observed that, at 128 concurrent users, EC2 instance CPU utilization reached approximate 80-90% capacity.
The following sections provide details of the setup and test results.
Test environment setup
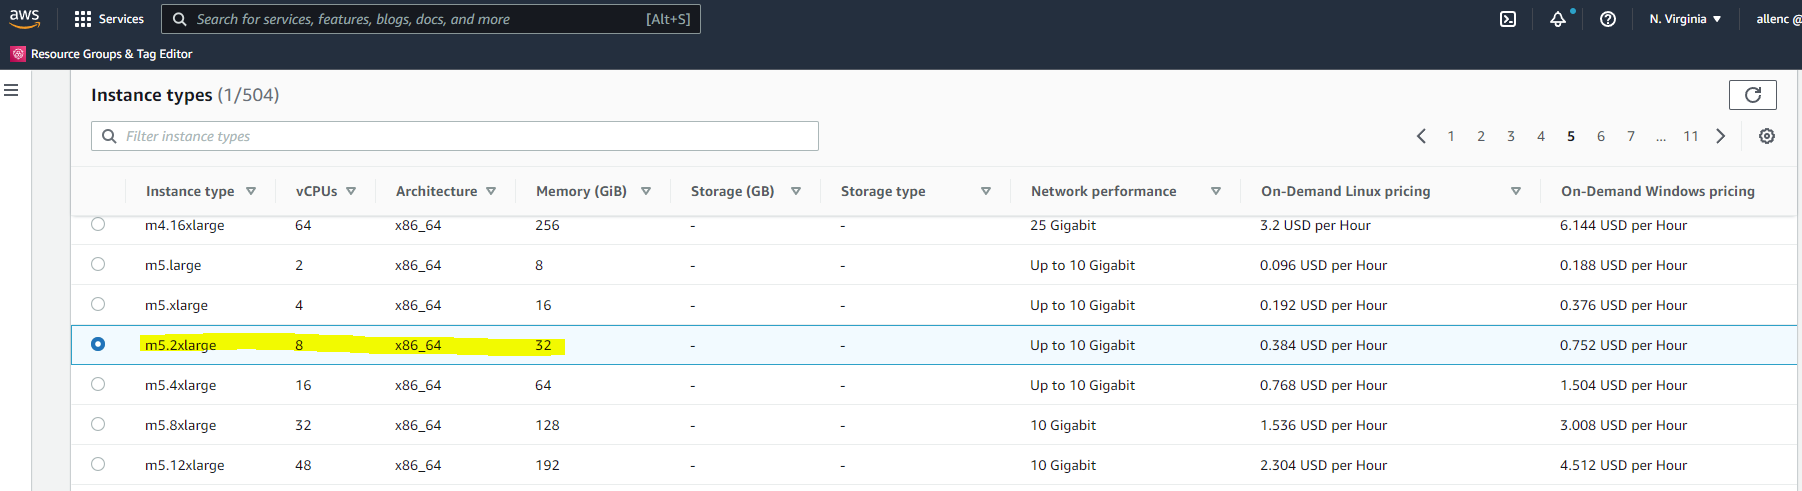
Compute
We deployed an EC2 M5 instance with 8vCPU, 32G RAM, and 10Gps of network bandwidth.
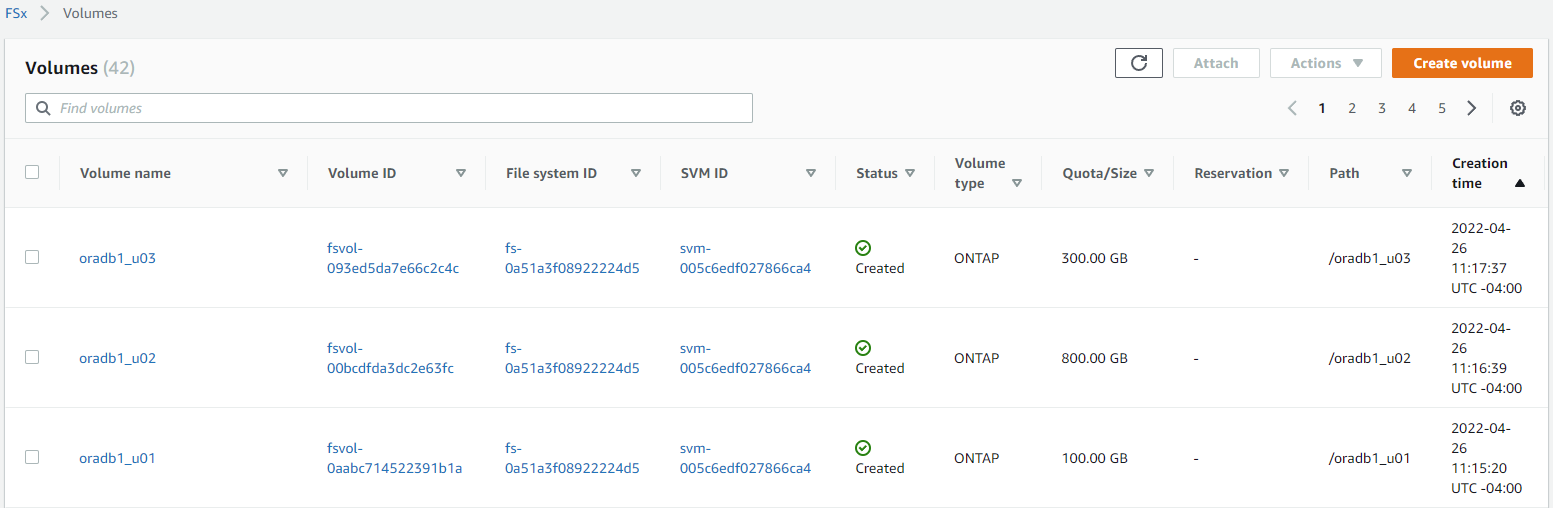
FSx storage
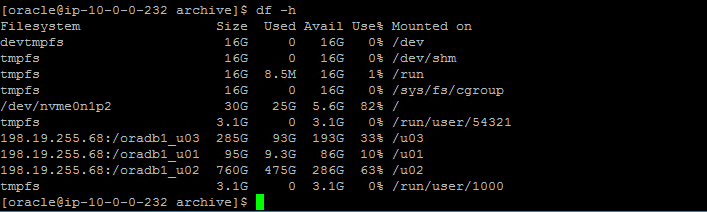
We created three database volumes and mounted the volumes with NFS on an EC2 instance as follows:
-
/u01 - Oracle binary
-
/u02 - Oracle data files, control file
-
/u03 - Oracle log files, control file
We kept two copies of a critical control file for redundancy.
The FSx file system is configured with 80,000 IOPS capacity and 2GiBps I/O throughput.
Oracle configuration
We installed Oracle version 19c with RU patch 19.8. dNFS was enabled on the server.
The database was deployed as a containerized database with three PDBs. We used one PDB instance for performance testing. The following figure shows the Oracle storage sizing on the NFS mount points.
Swingbench configuration
We deployed Swingbench 2.6 (the latest version) on a Windows host with 8vCPU and 32G RAM. We used the SOE plsql test module version 2 for the benchmark. The default load profile provides a 80/20 read/write ratio to simulate real world OLTP transaction workload.
The schema scale factor we used was 50, which provided an initial data load size of 160G and 30G of temporary space allocation. At this scale factor, the SOE schema provided 1000 warehouses and 50 millions customers for the simulation of online order processing.
The following screen shot demonstrates the workload profile and typical transactional run metrics from the Swingbench Windows UI.

As this graph shows, the transaction level was sustained at the same level throughout the test run.
Test results analysis
We captured Swingbench results for each test run and obtained the corresponding Oracle AWR reports for performance analysis.
From the end-user side, we looked at key metrics such as the transactions volume and user response time. Both metrics show how many transactions users can execute from the sales-order entry system given the number of concurrent users logging into the system as well as how fast users can complete transactions and receive response back after they entered their order.
From the Oracle server end, we parsed the Oracle AWR report to determine the top wait events that might have slowed down user transactions. The top 10 Oracle wait events indicated that, during Swingbench simulated transaction test runs, Oracle server is mostly I/O bound with as much as 50%-60% of database time spent on db file sequential read. log file sync is also a contributing factor because transaction commits cause the Oracle logging process to flush log I/O from the buffer cache to the log file on the disk, although it is a smaller factor on the database-time-percentage level.
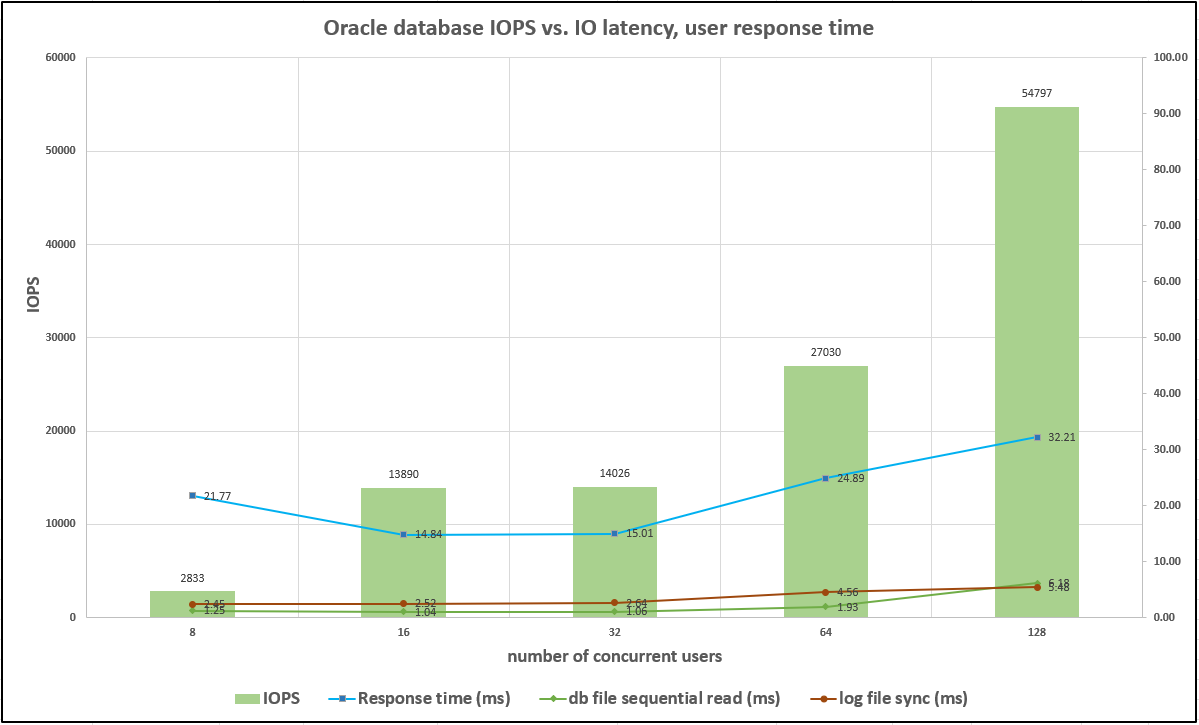
We charted the user transaction volume, user response time, and Oracle top wait events against the number of concurrent users during a transaction run. The results are shown below:
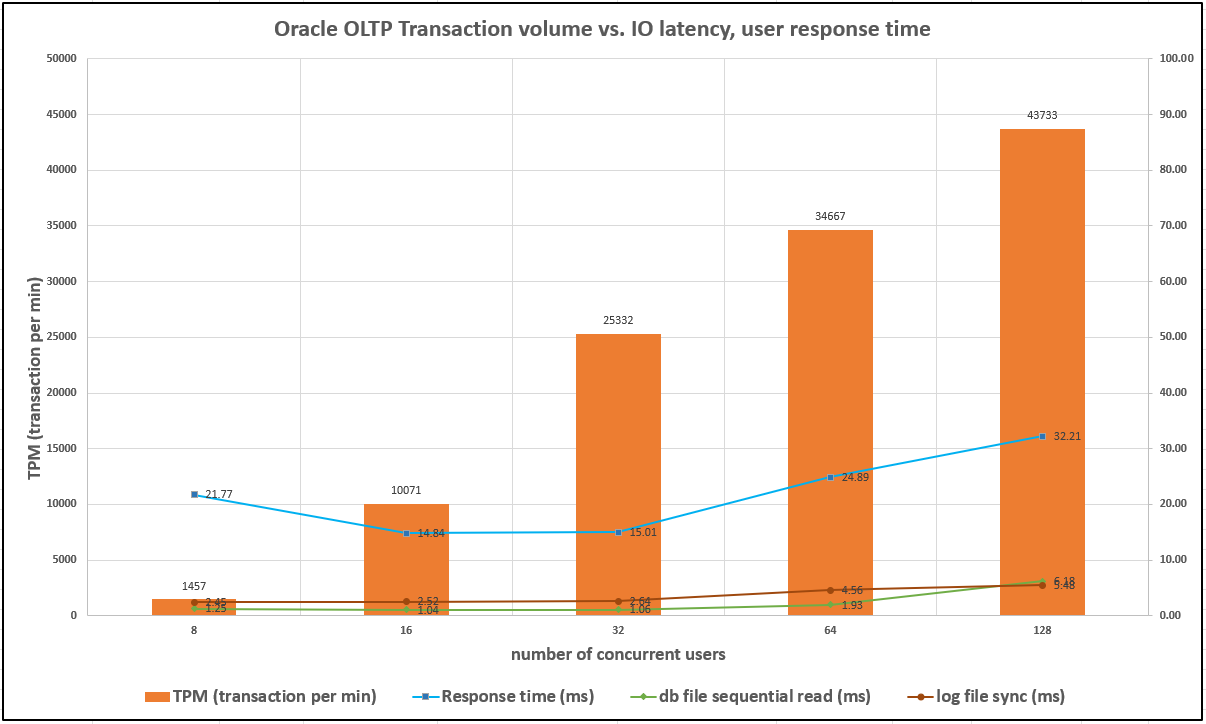
These result indicate that we could steadily increase the user transaction volumes with an increased number of concurrent users while maintaining consistently low I/O latency and user response time, which is appropriate performance for an Oracle application.
The I/O latency and user response time began to increase somewhat when we reached 128 concurrent users. This is expected because the EC2 instance is approaching full server capacity, as shown in the following diagram:

Similarly, the following the diagram shows the corresponding FSx IOPS and throughput while fulfilling the user transaction volumes at the time.
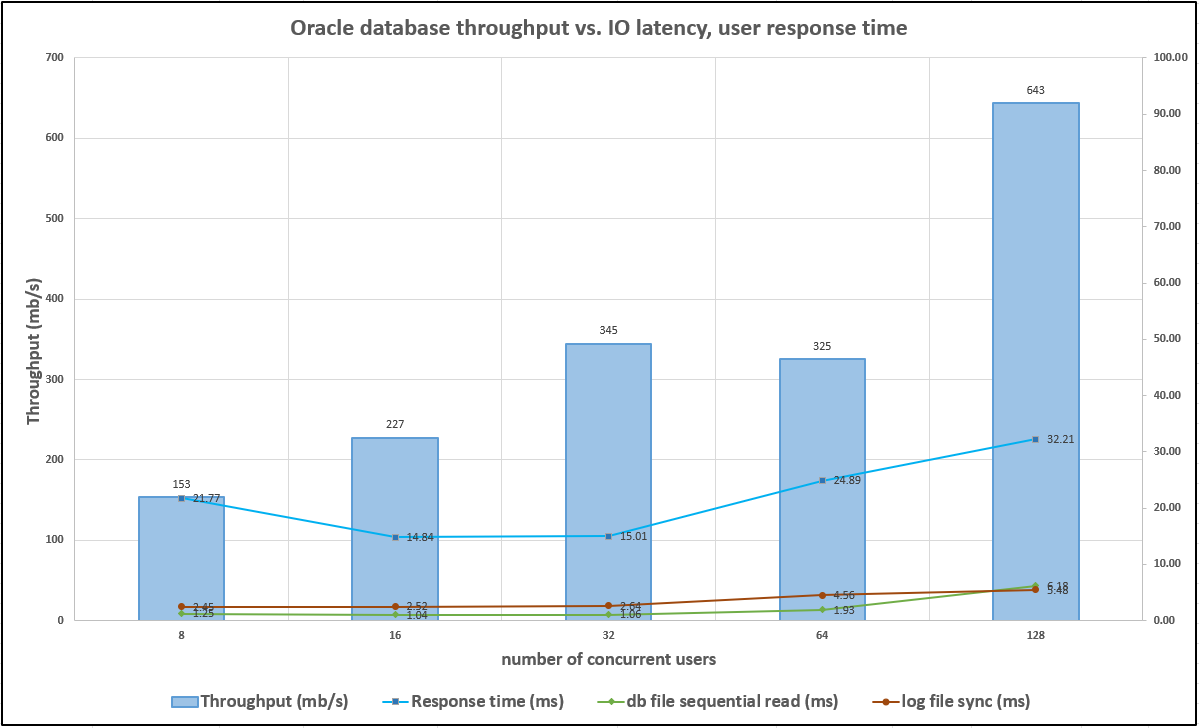
We did not reach the provisioned FSx storage capacity either in IOPS or throughput when the Oracle server EC2 instance became the limiting factor. Therefore, you must properly size compute and storage based on the user application-level transaction volume, as we demonstrate in the section "Factors to consider for Oracle database deployment."