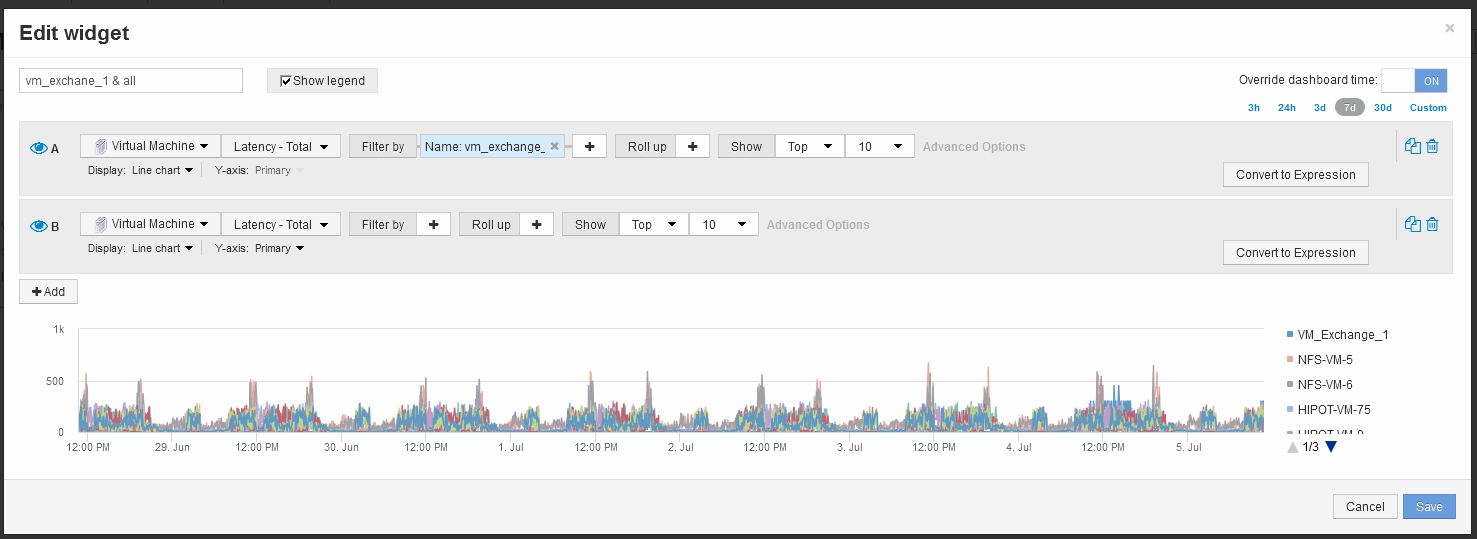
Compare one object's latency total to the latency total of the top 10 objects
 Suggest changes


The following steps compare a single VM's Latency Total to the VMs reporting the Top 10 Latency Total in the entire virtual infrastructure.
Steps
-
Add a widget with a line chart to the to the new dashboard: Widget > Line Chart
-
Change the default device to Virtual machine: Click Storage > Virtual machine > Latency-total
The widget displays the total Latency, for all VMs, for the default 24 hours in an area chart.
-
Create a second display in this widget that shows Latency Total averaged for all VMs: Widget > Line chart
-
Change the default device to Virtual machine: Click Storage > Virtual machine > Latency-Total
The widget displays the Latency total for the default 24 hour period of time using a line chart.
-
Click X on the Roll up bar and select Show > Top > 10
The system displays the Top 10 VMs based on Latency - Total.

-
-
Add the VM that you want to compare to the Top 10:
-
Click +Add
-
Change the default device to Virtual machine: Click Storage > Virtual machine > Latency total
-
Click Filter by > Name > $var1
-
-
Click Show legend
Results
A legend identifies each of the VMs under analysis. You can easily identify VM_Exchange_1 and determine if it is experiencing latency similar to the top ten VMs in the environment.


