How the cluster discovery process works
 Suggest changes


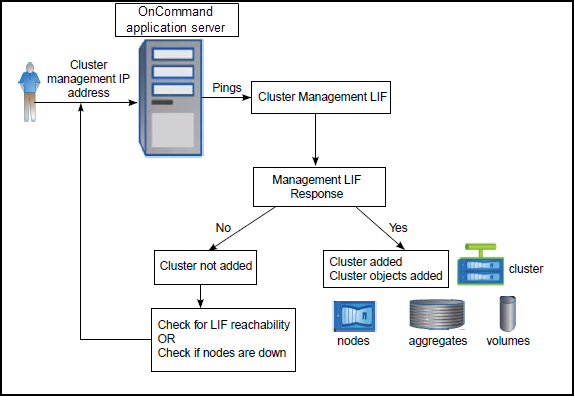
After you have added a cluster to Unified Manager, the server discovers the cluster objects and adds them to its database. Understanding how the discovery process works helps you to manage your organization's clusters and their objects.
The monitoring interval for collecting cluster configuration information is 15 minutes. For example, after you have added a cluster, it takes 15 minutes to display the cluster objects in the Unified Manager UI. This time frame is also true when making changes to a cluster. For example, if you add two new volumes to an SVM in a cluster, you see those new objects in the UI after the next polling interval, which could be up to 15 minutes.
The following image illustrates the discovery process:

After all the objects for a new cluster are discovered, Unified Manager starts to gather historical performance data for the previous 15 days. These statistics are collected using the data continuity collection functionality. This feature provides you with over two weeks of performance information for a cluster immediately after it is added. After the data continuity collection cycle is completed, real-time cluster performance data is collected, by default, every five minutes.

|
Because the collection of 15 days of performance data is CPU intensive, it is suggested that you stagger the addition of new clusters so that data continuity collection polls are not running on too many clusters at the same time. |


