Understanding the Performance dashboard
 Suggest changes


The Unified Manager Performance dashboard provides a high-level overview of the performance status for all the clusters that are being monitored in your environment. Clusters that have performance issues are ordered at the top of the page by severity. The information on the dashboard is updated automatically at each five-minute performance collection period.
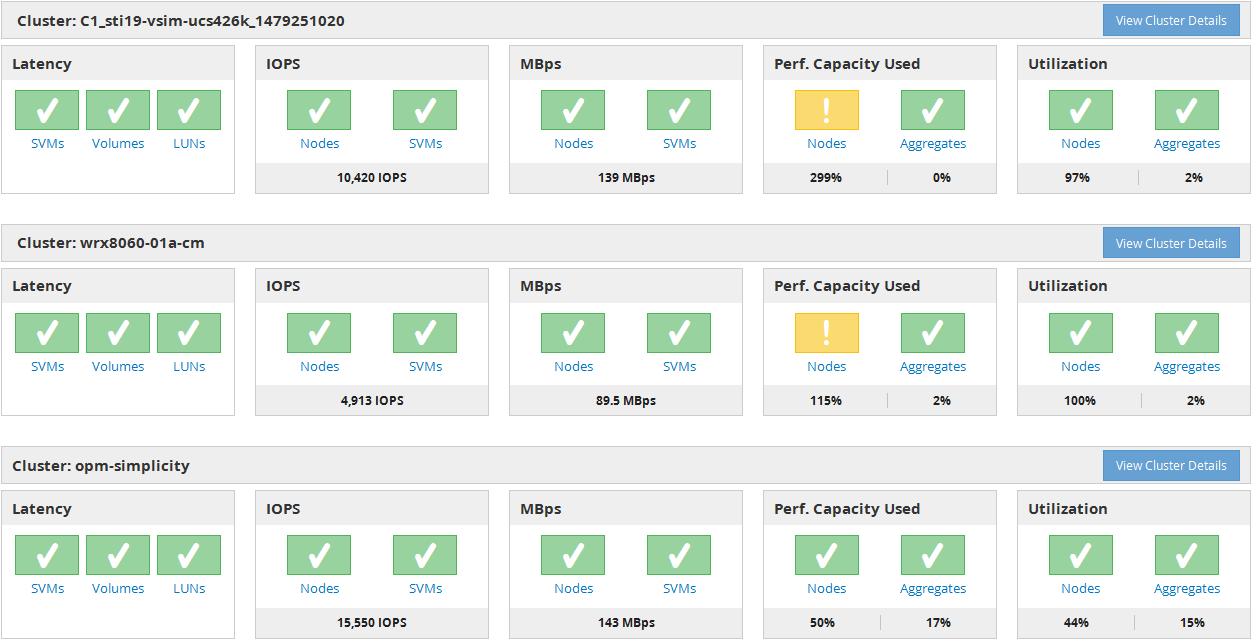
The following image shows an example of a Unified Manager Performance dashboard that is monitoring two clusters:

The status icons that represent the storage objects can be in the following states, sorted from highest severity to lowest severity:
-
Critical (
 ): One or more new critical performance events have been reported for the object.
 -
Warning (
 ): One or more new warning performance events have been reported for the object.
 -
Normal (
 ): No new performance events have been reported for the object.

|
The color indicates whether new events exist for the object. Events that are no longer active, called obsolete events, do not affect the color of the icon. |
Cluster performance counters
The following performance categories are displayed for each cluster:
-
Latency
Shows how quickly the cluster is responding to client application requests, in milliseconds per operation.
-
IOPS
Shows the operating speed of the cluster, in number of input/output operations per second.
-
MBps
Shows how much data is being transferred to and from the cluster, in megabytes per second.
-
Performance Capacity Used
Shows whether any nodes or aggregates are overusing their available performance capacity.
-
Utilization
Shows whether the resources on any nodes or aggregates are being overused.
To analyze the performance of your cluster and storage objects, you can perform one of the following actions:
-
You can click View Cluster Details to display the Cluster Landing page, where you can view detailed performance and event information for the selected cluster and storage objects.
-
You can click one of the red or yellow status icons of an object to display the Inventory page for that object, where you can view details about the storage object.
For example, clicking a volume icon displays the Performance/Volume inventory page with a list of all the volumes in the selected cluster, sorted from worst performance to best performance.


