

All Nodes View
 Suggest changes
You can view information about all nodes for a company, including throttled nodes, when you select the company name from the All Nodes View drop-down list. After you select the company name, it replaces All Nodes View in the top navigation bar.

|
If your SolidFire Active IQ account has only one company name associated with it, the All Nodes and Throttled Nodes pages, available from the side panel, default to that company name. |
Learn more about the All Nodes and Throttled Nodes pages:
View information about all nodes
On the All Nodes page, available from the side panel, you can view information about all nodes for your selected company.
| Heading | Description |
|---|---|
Cluster ID |
Assigned cluster number when the cluster is created. |
Cluster |
Name assigned to the cluster. |
Node ID |
System-generated ID for the node. |
Status |
The status of the node:
|
Name |
The system-generated node name. |
Type |
Shows the model type of the node. |
Serial Number |
Unique serial number assigned to the node. |
Version |
Version of Element software running on the node. |
Management IP |
Management IP address assigned to node for 1GbE or 10GbE network admin tasks. |
Storage IP |
Storage IP address assigned to the node used for iSCSI network discovery and all data network traffic. |
Role |
Identifies what role the node has in the cluster:
|
View information about throttled nodes
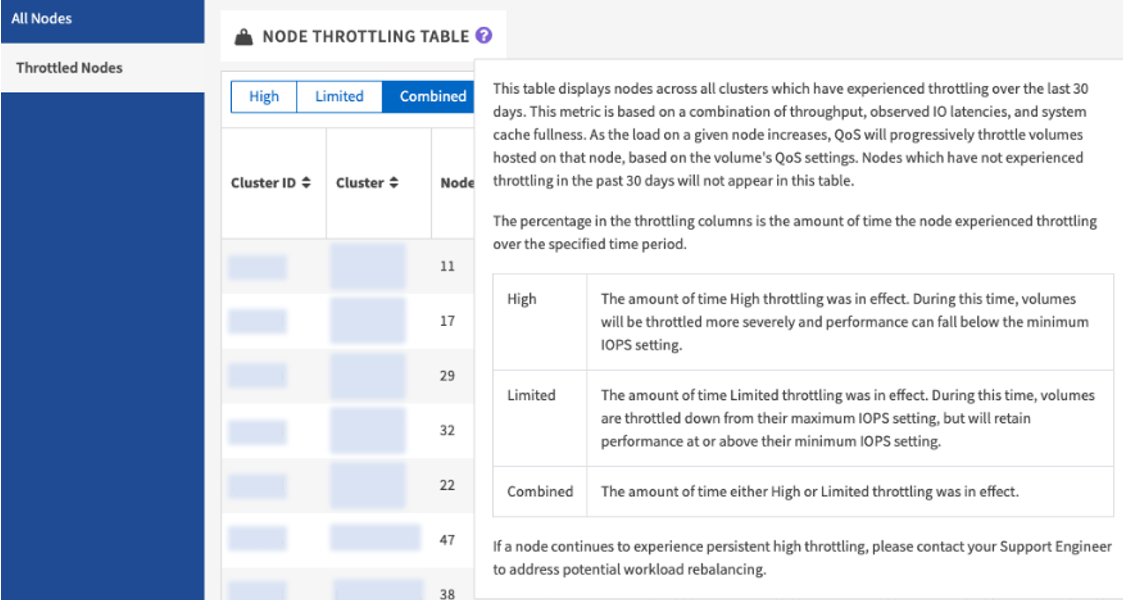
On the Throttled Nodes page, available from the side panel, you can view information for all nodes with throttling greater than 1% in the last 30 days for your selected company.
You have the option to view nodes with a High, Limited, or Combined (high and limited) throttling time. You can also view descriptions for the node throttling table and the high, limited, and combined throttling options by selecting the  icon, as shown in the following example:
Learn more about the information available for throttled nodes.
| Heading | Description |
|---|---|
Cluster ID |
Assigned cluster number when the cluster is created. |
Cluster |
Name assigned to the cluster. |
Node ID |
System-generated ID for the node. |
Name |
The system-generated node name. |
Type |
Shows the model type of the node. |
Version |
Version of Element software running on the node. |
High throttling time view |
|
High Throttle Last 24 hours |
The percentage of high node throttling in the last 24 hours. |
High Throttle Last 7 days |
The percentage of high node throttling in the last 7 days. |
High Throttle Last 14 days |
The percentage of high node throttling in the last 14 days. |
High Throttle Last 30 days |
The percentage of high node throttling in the last 30 days. |
Limited throttling time view |
|
Limited Throttle Last 24 hours |
The percentage of limited node throttling in the last 24 hours. |
Limited Throttle Last 7 days |
The percentage of limited node throttling in the last 7 days. |
Limited Throttle Last 14 days |
The percentage of limited node throttling in the last 14 days. |
Limited Throttle Last 30 days |
The percentage of limited node throttling in the last 30 days. |
Combined throttling time view |
|
Combined Throttle Last 24 hours |
The percentage of combined node throttling in the last 24 hours. |
Combined Throttle Last 7 days |
The percentage of combined node throttling in the last 7 days. |
Combined Throttle Last 14 days |
The percentage of combined node throttling in the last 14 days. |
Combined Throttle Last 30 days |
The percentage of combined node throttling in the last 30 days. |
Average Throughput Last 30 mins |
Sum of average throughputs executed in the last 30 minutes against all volumes that have this node as their primary. |
Average IOPS Last 30 mins |
Sum of the average number of IOPS executed in the last 30 minutes against all volumes that have this node as their primary. |
Average Latency (µs) Last 30 mins |
The average time in microseconds, as measured over the last 30 minutes, to complete read and write operations to all volumes that have this node as their primary. To report this metric based on active volumes, only non-zero latency values are used. |