

Upgrade Health Checker dashboard
 Suggest changes
A static HTML dashboard is generated at runs/dashboard/index.html at the end of every Upgrade Health Checker run. The dashboard provides a high-level overview of the health status of clusters assessed recently, allowing you to monitor and compare upgrade readiness across clusters.
To regenerate the dashboard later (without contacting a cluster), run:
./uhc --dashboard
./uhc --dashboard --runs-path /custom/output
./uhc --dashboard --config-path /path/to/custom_config.yaml
The following is a view of a recently generated Upgrade Health Checker dashboard.
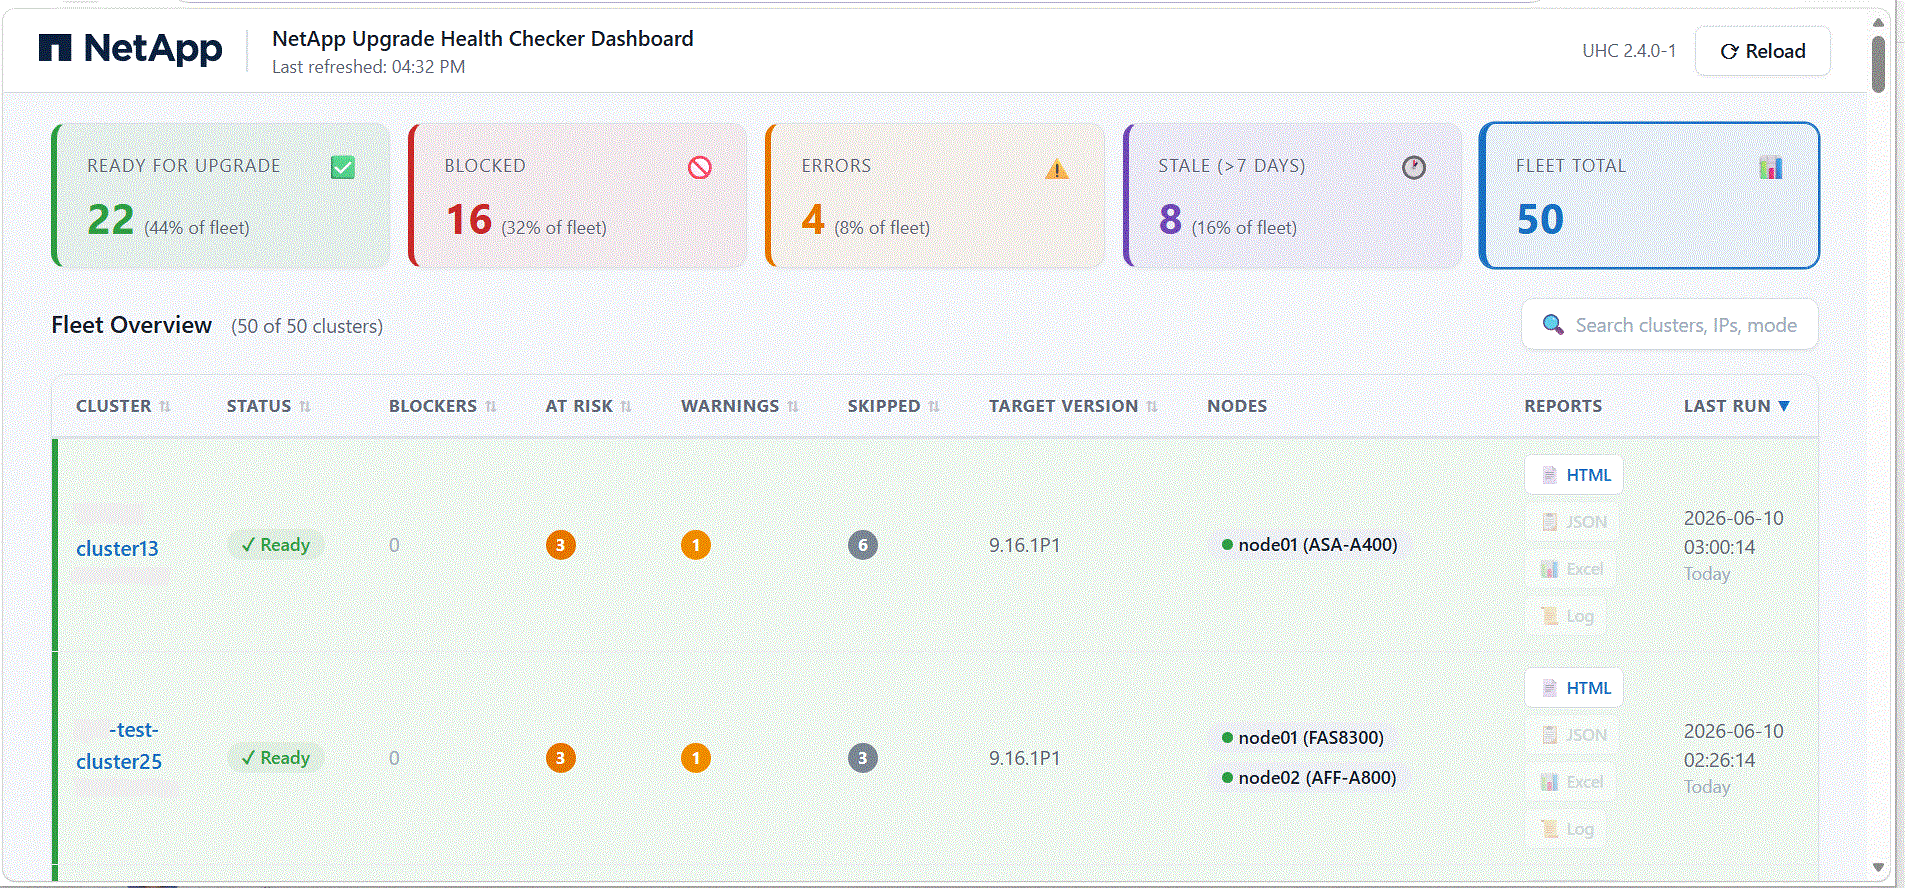
At the top of the page there are five color-coded summary cards (each one is also a selectable filter) showing:
-
Ready for upgrade: Number of clusters whose latest health check found no blockers, i.e. ready to upgrade.
-
Blocked: Number of clusters blocked and unable to upgrade until the blockers are resolved.
-
Errors: Number of clusters whose latest UHC run failed to complete (e.g. connection, authentication, or data-collection failure).
-
Stale (>7): Number of clusters whose last UHC run was more than 7 days ago (the health-check data is stale).
-
Fleet total: Total number of clusters in the fleet, (those with a run in the dashboard window, default is the last 30 days).
The Fleet overview section details the current state of the fleet. For each cluster, the following are provided (the table shows the latest run per cluster):
-
Cluster name: Name of the cluster (with its management IP shown below the name).
-
Status: Current status of the cluster: Ready, Blocked, Error, or Stale.
-
Blockers: Number of blockers on the cluster. These are critical issues that must be resolved before upgrading.
-
At risk: Number of at-risk findings on the cluster. These are risks identified during the pre-update check.
-
Warnings: Number of warnings on the cluster. The pre-update check completed with some warnings; you can choose to fix these warnings or continue with the update.
-
Skipped: Number of checks that were skipped on the cluster.
-
Target version: The ONTAP version the user intends to upgrade to. (It can be the same as the current version if you only want to run a health check on the running release.)
-
Nodes: The cluster's nodes, each shown as node name with its hardware model (e.g. eurbkpcla (FAS8200)).
-
Reports: Available report formats for the run: HTML, JSON, Excel, Log.
-
Last run: Date and time of the last Upgrade Health Checker run (with a relative "X days ago").
You can select Reload to refresh the page. Use the Search bar to search for details of a specific cluster.