Spot Overview
 About NetApp
 Elastigroup
 Ocean
Ocean Ocean CD
 Eco
Eco Ocean for Apache Spark
 Spot Security
 Case Studies
 About Us
 Contact Us
 Careers
We’ve saved roughly 60% off our compute costs, which I find pretty amazing.
– Max Blaze, Staff Operations Engineer
 Cloud Financial Management (FinOps)Reduce and govern cloud spend without sacrificing flexibility
 Autoscaling applicationsAutomate infrastructure for scale-out applications
 Amazon Web ServicesCloud optimization for AWS
 Big dataAutonomous cloud infrastructure for big data applications
 Container infrastructureDeliver hands-free infrastructure for cloud-native workloads
 Microsoft AzureCloud optimization for Azure
 Reserved commitment managementOptimize strategy and lifecycle for cloud commitment purchases
 Cloud services for MSPsDelivered differentiated cloud management services
 Google CloudCloud optimization for Google Cloud
 Resource CenterThe spot for more information about our products and solutions
 DocumentationA central hub for information on using our products
 NewsUpdates on our company, products and features
 Service StatusA summary of current system status
 What Is CloudOps?Unlock the true value of the cloud
 How to Operationalize FinOpsBuild a highly efficient FinOps practice
Reliably, securely and efficiently deploy and operate infrastructure and applications in the cloud with Spot by NetApp solutions. Using continuous optimization, automation and insights, our products and technologies free operations teams from complexity and inefficiency so that you can maximize the value of your cloud investment.

Free operations teams from complexity and overhead with solutions that automate deployment, scaling and resource management

Easily deploy, operate and scale infrastructure and applications based on best practices and real-time and predictive analytics of application needs

Utilize visibility, insights and automation to continuously optimize your cloud infrastructure, reducing costs and maximizing efficiency

Spot gives operations teams optimization and automation technology that helps them ensure performance, reduce complexity and optimize costs. Give your cloud workloads the benefits of best-in-class operations.
Use visibility and insights to manage cloud spend and cost allocation and to optimize cloud commitments to reduce costs with a governed, scalable approach.
Continuously optimize cloud resources for virtual machines, containers and Kubernetes to reduce costs and automate operations.
Take informed and timely action with contextualized visibility that cuts through the noise to show and prioritize threats for remediation.

From startups to global enterprises, discover how we’re helping our customers automate, simplify and optimize their cloud operations.
We’ve saved roughly 60% off our compute costs, which I find pretty amazing.
– Max Blaze, Staff Operations Engineer
Spot by NetApp’s Elastigroup looked too good to be true, but we were convinced once we understood how the solution worked in our environment.
– Richard Marsh, director of operations
We knew the promise of spot instances, but it was hard for us to manage. Spot solves this exact problem for us.
– Vaibhav Puranik, SVP Engineering
As of today, 100% of our K8s workers are running with Spot. We are not thinking about cost any more, Spot does that for us!
– Shane Savoie, Chief Architect
Our successful adoption of microservices and containers in large part can be attributed to Spot keeping infra cost and management to a bare minimum.
– Steve Evans, VP of Engineering Services
We get better performance and more instance for our money. Spot is just easier to use, especially for Kubernetes.
– Michael Waltz, Principal DevOps Engineer
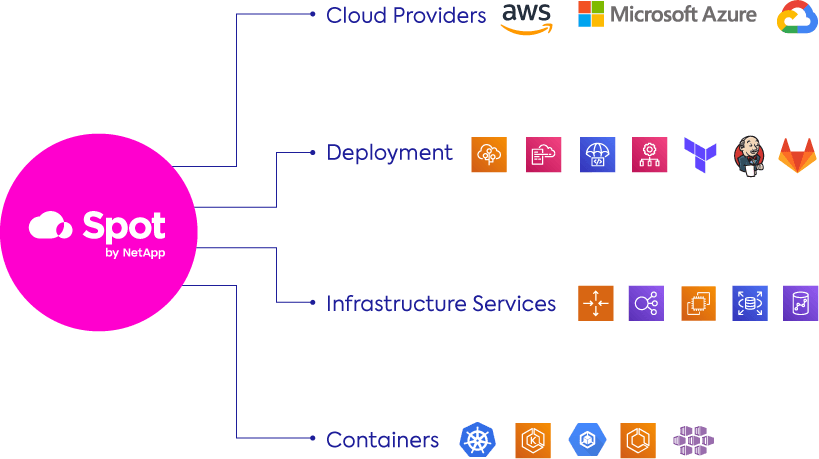
Our software works with leading cloud platforms, services, and tools so that you can simplify and automate your cloud infrastructure wherever your workloads and applications run and however you run them.

Learn about our suite of cloud workload automation and optimization solutions.
Our free trial for up to 20 instances will show how Spot automates cloud infrastructure for optimized operational and cost efficiency.
Start free trial
Integrate with your existing AWS billing when you subscribe through the AWS marketplace
![]()
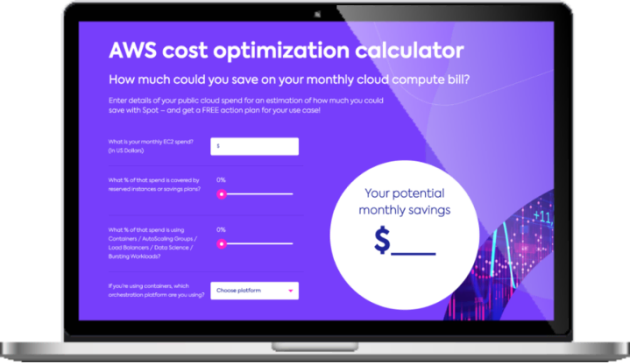
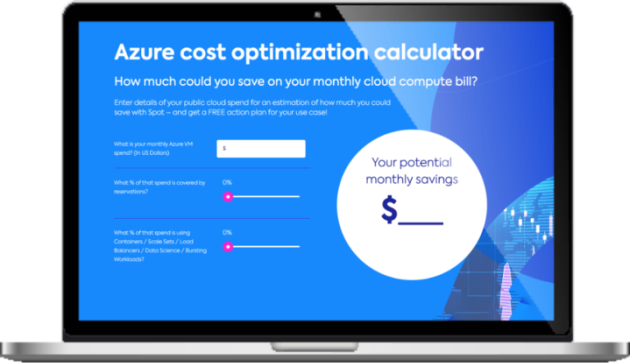
Easily calculate how much you can save on your cloud spend. See how Spot by NetApp dramatically cuts compute costs by reliably leveraging an optimal blend of spot, reserved and on-demand pricing.
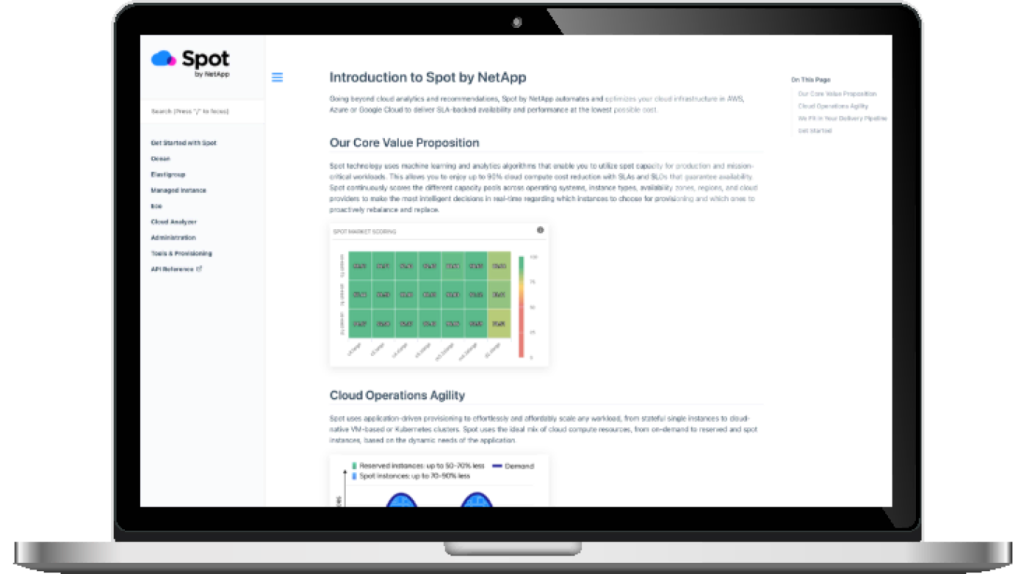
Take a deep-dive into our documentation library and our OpenAPI Specification. Here you’ll find all the technical details as well as REST definitions for our product suite and platform administration tasks.
Start exploring