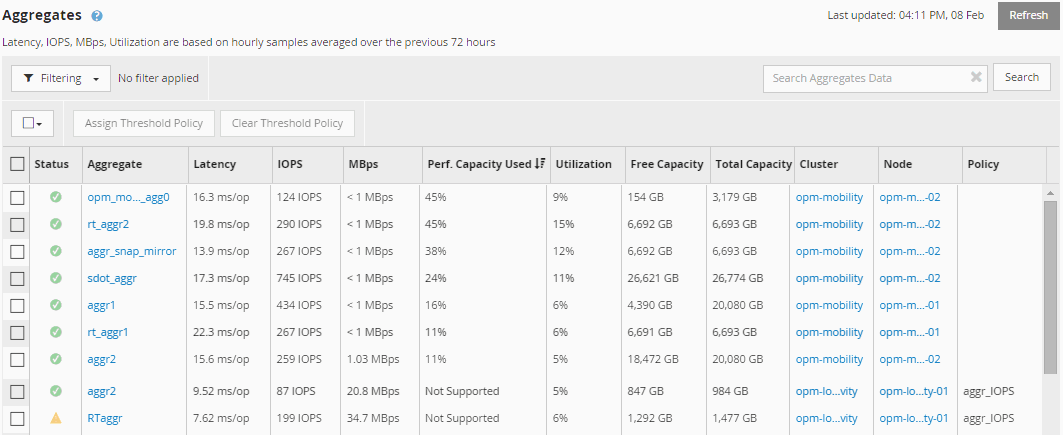
Viewing node and aggregate performance capacity used values
 Suggest changes


You can monitor the performance capacity used values for all nodes or for all aggregates in a cluster, or you can view details for a single node or aggregate.
Performance capacity used values appear in the Dashboard, Performance Inventory pages, Top Performers page, Create Threshold Policy page, Performance Explorer pages, and in detail charts. For example, the Performance: All Aggregates page provides a column Perf. Capacity Used to view the performance capacity used value for all aggregates.

The status “N/A” is displayed when nodes are not installed with ONTAP 9.0 or later software.
Monitoring the performance capacity used counter enables you to identify the following:
-
Whether any nodes or aggregates on any clusters have a high performance capacity used value
-
Whether any nodes or aggregates on any clusters have active performance capacity used events
-
The nodes and aggregates that have the highest and lowest performance capacity used value in a cluster
-
Latency and utilization counter values in conjunction with nodes or aggregates that have high performance capacity used values
-
How the performance capacity used values for nodes in an HA pair will be affected if one of the nodes fails
-
The busiest volumes and LUNs on an aggregate that has a high performance capacity used value


