Anomaly Detection Monitors
 Suggest changes
Anomaly Detection provides insight into unexpected changes in the patterns of data on your tenant. An anomaly occurs when the pattern of an object's behavior changes, for example, if an object experiences a certain level of latency at a certain time on Wednesdays, but latency spikes above that level at that time on the subsequent Wednesday, that spike would be considered an anomaly. Data Infrastructure Insights allows the creation of monitors to alert when anomalies such as this occur.
Anomaly detection is suitable for object metrics that exhibit a recurring, predictable pattern. When these object metrics spike above or drop below their expected levels, Data Infrastructure Insights can generate an alert to prompt investigation.

What is Anomaly Detection?
An anomaly occurs when the mean value of a metric is a number of standard deviations away from the weighted mean of that metric for the previous few weeks, with recent weeks having more weight than previous weeks. Data Infrastructure Insights provides the ability to monitor data and alert when anomalies are detected. You have a choice to set the "sensitivity" levels of detection. For example, a higher sensitivity would be when the mean value is fewer standard deviations from the mean, thus causing more alerts to be generated. Conversely, lower sensitivity = more standard deviations from mean = fewer alerts.
Anomaly Detection monitoring differs from Threshold Monitoring.
-
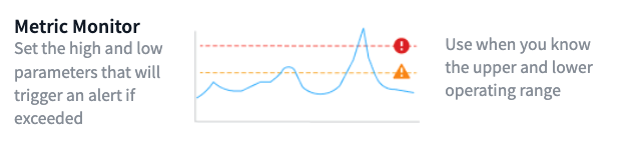
Threshold-based monitoring works when you have pre-defined thresholds for specific metrics. In other words, when you have a clear understanding of what is expected (i.e. within a normal range).
-
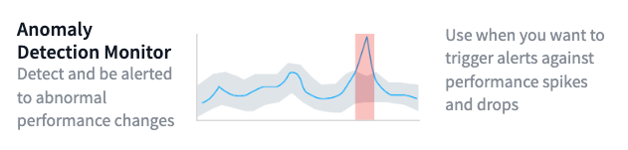
Anomaly Detection monitoring uses machine learning algorithms to identify outliers that deviate from the norm, for when the definition of "normal" is not clear.
When would I need Anomaly Detection?
Anomaly Detection monitoring can provide helpful alerts for many situations, including the following:
-
When the definition of normal is unclear. For example, SAN error rates may be expected in varying amounts depending on port. Alerting on one error is noisy and unnecessary, but a sudden or significant increase could indicate a widespread issue.
-
Where there are changes over time. Workloads that exhibit seasonality (i.e. they are busy or quiet at certain times). This could include unexpected quiet periods that may Indicate a batch stall.
-
Working with large amounts of data where manually defining and adjusting thresholds is impractical. For example, a tenant with a large numbers of hosts and/or volumes with varying workloads. Each may have different SLAs, so understanding the ones that exceed the norm is important.
Creating an Anomaly Detection Monitor
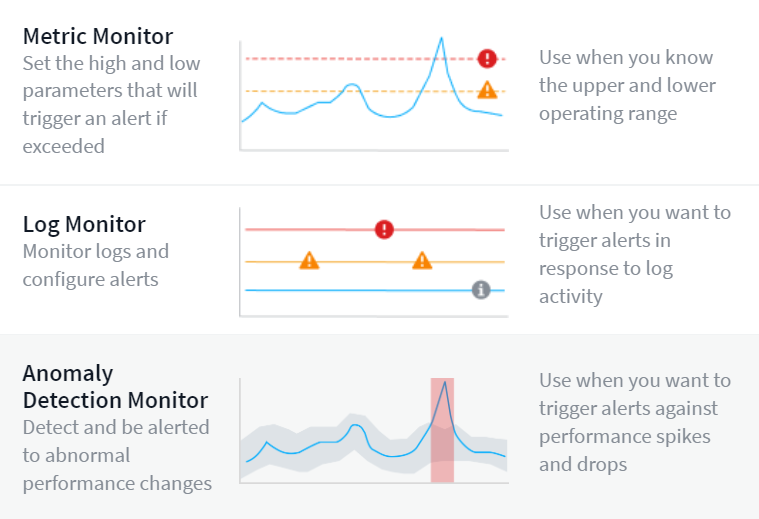
To alert on anomalies, create a monitor by navigating to Observability > Alerts > +Monitor. Select Anomaly Detection Monitor as the monitor type.
Choose the object and metric you want to monitor. You can set filters and grouping as with other types of monitors.
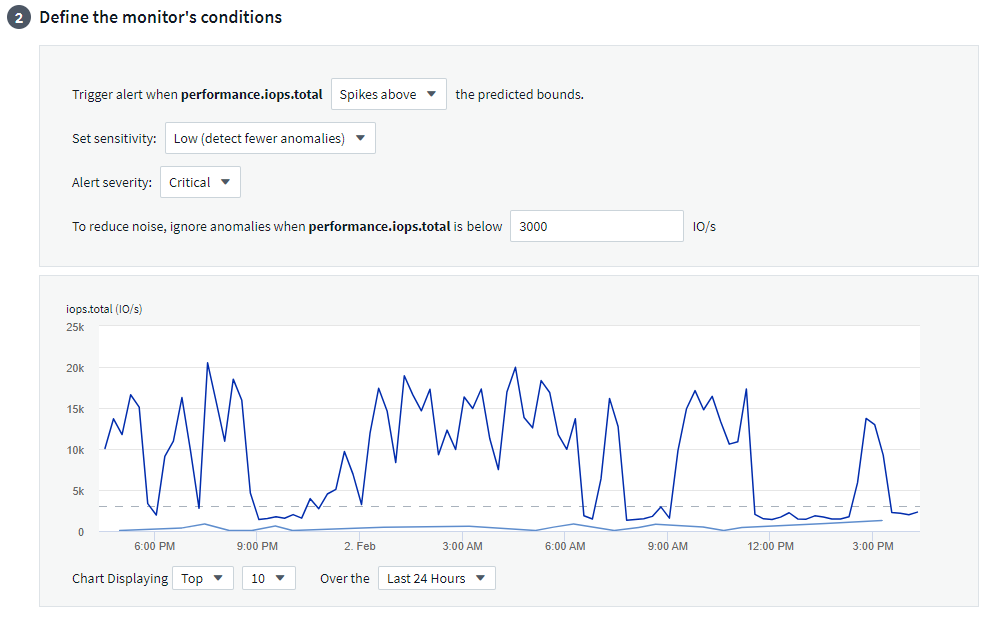
Next, set the conditions for the monitor.
-
Trigger an alert when the selected metric either Spikes above the predicted bounds, Drops below those bounds, or both.
-
Set sensitivity to Medium, Low (fewer anomalies are detected), or High (more anomalies are detected).
-
Determine whether the alert level is Critical or Warning.
-
Optionally, set a value below which anomalies are ignored. This can help reduce noise. This value is shown as a dashed line on the sample graph.
Finally, you can configure a delivery method for the alerts (email, webhook, or both), give the monitor an optional description or corrective actions, and add the monitor to a custom group, if desired.
Save the monitor with a meaningful name, and you're done.
Upon creation, the monitor analyzes data from the previous week to establish an initial baseline. Anomaly detection becomes more accurate as time passes and more history occurs.

|
When a monitor is created, DII looks at any existing data for the week prior for significant data spikes or drops; these are considered anomalies. During the first week after monitor creation (the "learning" phase), there is a chance for increased "noise" in alerts. To mitigate this noise, only spikes or drops lasting longer than 30 minutes are considered anomalies and generate alerts. In the subsequent week as more data is analyzed the noise will typically reduce and a significant spike or drop lasting any period of time will be considered an anomaly.. |
Viewing the Anomalies
On an alert landing page, alerts triggered when anomalies are detected will show a highlighted band in the chart, from the time when the metric spiked outside the predicted bounds to when it moved back inside those bounds.
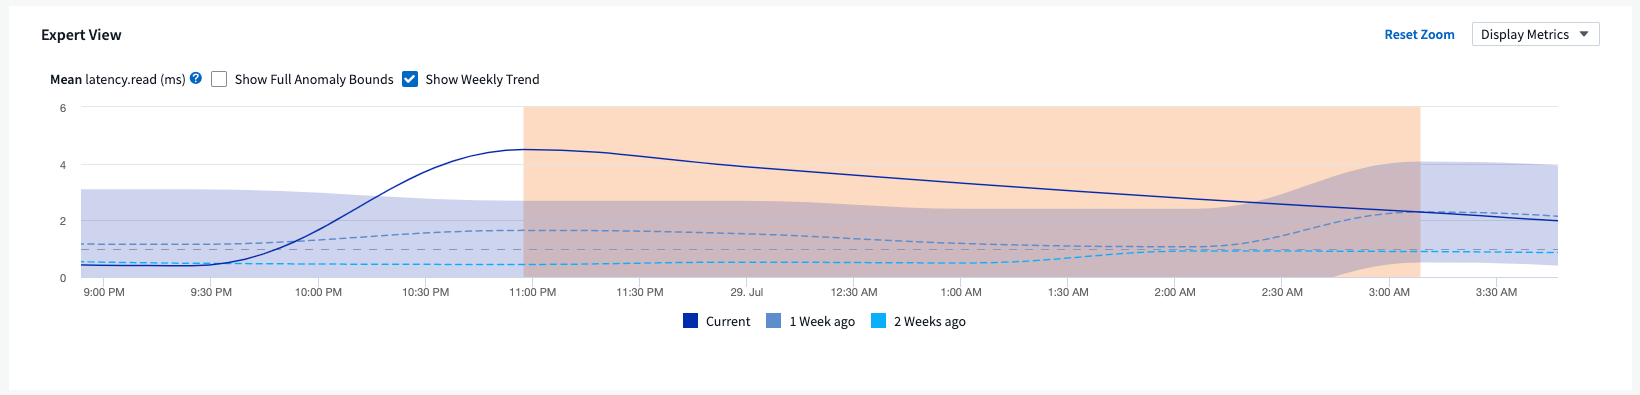
While viewing an anomaly chart on an alert landing page, you can choose the following options:
-
Weekly Trend: compare values to the same time, same day on previous weeks, for up to 5 previous weeks.
-
Full Anomaly Bounds: by default, the graph focuses on the metric value so you can better analyze the metric behavior. Select to show full anomaly bounds (maximum value, etc.)
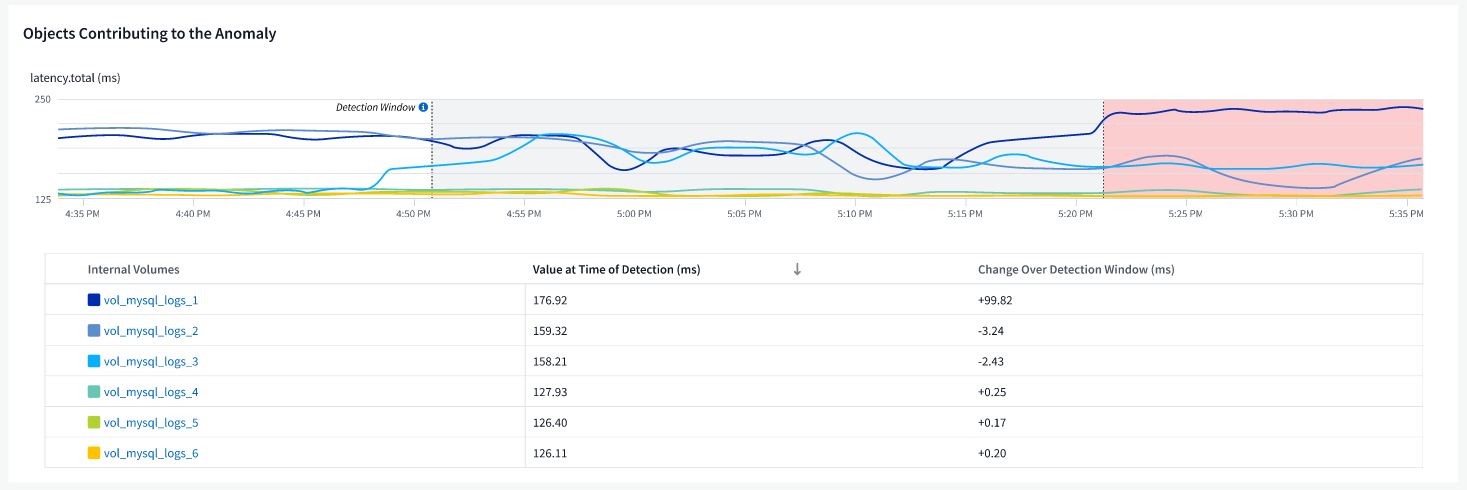
You can also view objects that contributed to the anomaly by selecting those in the landing page's performance section . The chart will show the behavior of the selected objects.