

Log Explorer
 Suggest changes
The Data Infrastructure Insights Log Explorer is a powerful tool for querying system logs. In addition to helping with investigations, you can also save a log query in a Monitor to provide alerts when those particular log triggers are activated.
To begin exploring logs, click Log Queries > +New Log Query.
Select an available log from the list.
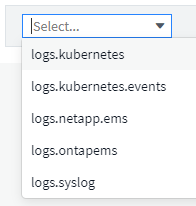

|
The types of logs available for querying may vary based on your environment. Additional log types may be added over time. |
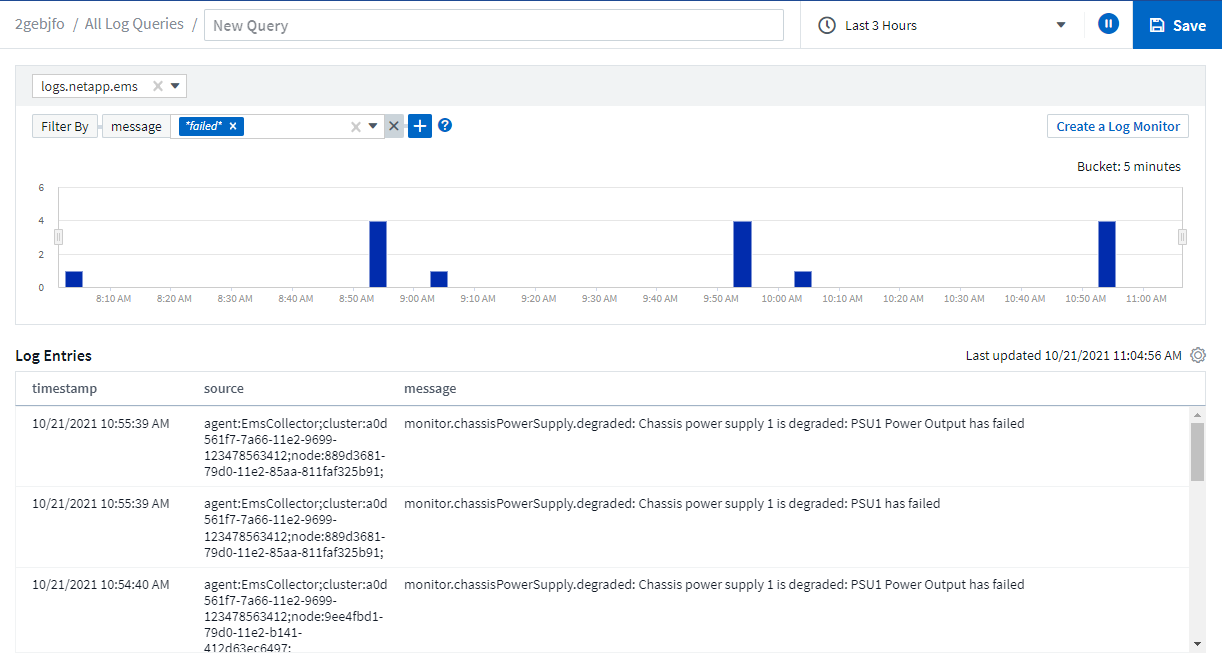
You can set filters to further refine the results of the query. For example, to find all log messages showing a failure, set a filter for Messages containing the word "failed".

|
You can begin typing the desired text in the filter field; Data Infrastructure Insights will prompt you to create a wildcard search containing the string as you type. |
The results are displayed in a graph showing the number of log instances in each time period shown. Below the graph are the log entries temselves. The graph and the entries refresh automatically based on the selected time range.
Filtering
Include / Exclude
When filtering the logs, you can choose to include (i.e. "Filter to") or exclude the strings you type. Excluded strings are displayed in the completed filter as "NOT <string>".
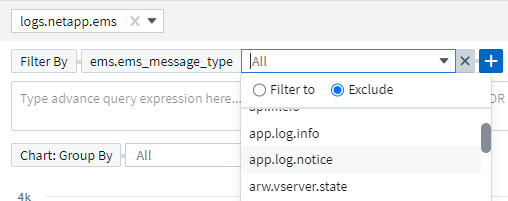
Filters based on wildcards or expressions (e.g. NOT, OR, "None", etc.) display in dark blue in the filter field. Items that you select directly from the list are displayed in light blue.
|
|
At any point, you can click on Create a Log Monitor to create a new Monitor based on the current filter. |
Advanced Filtering
When you are filtering for text or list values in queries or dashboard widgets, as you begin typing you are presented with the option to create a wildcard filter based on the current text. Selecting this option will return all results that match the wildcard expression. You can also create expressions using NOT, AND, or OR, or you can select the "None" option to filter for null values.
|
|
Be sure to Save your query early and often as you build your filtering. Advanced Querying is "free-form" string entry, and parsing mistakes may occur as you build. |
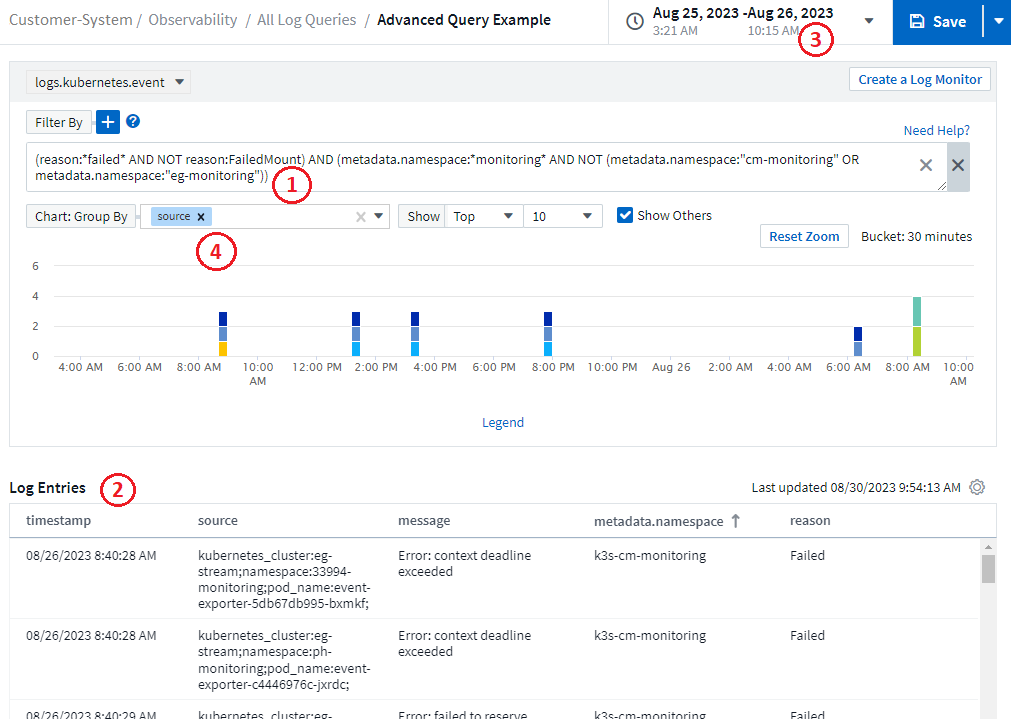
Take a look at this screen image showing filtered results for an advanced query of the logs.kubernetes.event log. There is a lot going on in this page, which is explained below the image:
-
This advanced query string filters for the following:
-
Filter for log entries with a reason that includes the word "failed", but not anything with the specific reason of "FailedMount".
-
Include any of those entries that also include a metadata.namespace including the word "monitoring", but exclude the specific namespaces of "cm-monitoring" or "eg-monitoring".
Note that in the case above, since both "cm-monitoring" and "eg-monitoring" contain a dash ("-"), the strings must be included in double-quotes or a parsing error will be displayed. Strings that do not include dashes, spaces, etc. do not need to be enclosed in quotes. If in doubt, try putting the string in quotes.
-
-
The results of the current filter, including any "Filter By" values AND the Advanced Query filter, are displayed in the results list. The list can be sorted by any displayed columns. To display additional columns, select the "gear" icon.
-
The graph has been zoomed in to show only log results that occurred within a specific time frame. The time range shown here reflects the current zoom level. Select the Reset Zoom button to set the zoom level back to the current Data Infrastructure Insights time range.
-
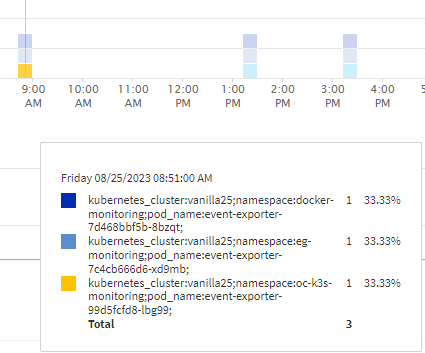
The chart results have been Grouped By the source field. The chart shows results in each column grouped into colors. Hovering over a column in the chart will display some details about the specific entries.
Refining Filters
You can use the following to refine your filter:
Filter |
What it does |
* (Asterisk) |
enables you to search for everything |
? (question mark) |
enables you to search for a specific number of characters |
OR |
enables you to specify multiple entities |
NOT |
allows you to exclude text from the search results |
None |
searches for NULL values in all fields |
Not * |
searches for NULL values in text-only fields |
If you enclose a filter string in double quotes, Insight treats everything between the first and last quote as an exact match. Any special characters or operators inside the quotes will be treated as literals. For example, filtering for "*" will return results that are a literal asterisk; the asterisk will not be treated as a wildcard in this case. The operators OR and NOT will also be treated as literal strings when enclosed in double quotes.
You can combine a simple filter with an advanced query filter; the resulting filter is an "AND" of the two.
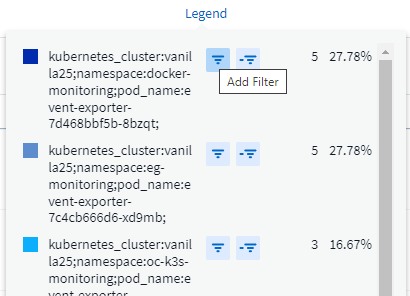
The Chart Legend
The Legend below the chart has a few surprises as well. For each result (based on the current filter) shown in the Legend, you have an option to display only results for that line (Add Filter), or to display any results NOT for that line (Add Exclude Filter). The chart and the Log Entries list update to show results based on your selection. To remove this filtering, open the Legend again and select the [X] to clear the Legend-based filter.
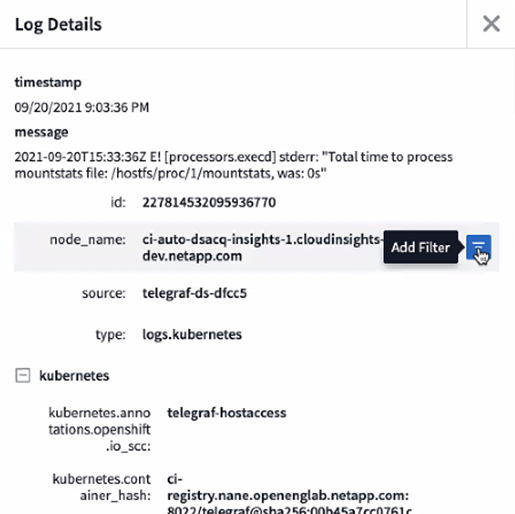
Log Details
Clicking anywhere in a log entry in the list will open a detail pane for that entry. Here you can explore more information about the event.
Click on "Add Filter" to add the selected field to the current filter. The log entry list will update based on the new filter.
Note that some fields cannot be added as filters; in those cases, the Add Filter icon is not available.
Troubleshooting
Here you will find suggestions for troubleshooting problems with Log Queries.
Problem: |
Try this: |
I don't see "debug" messages in my log query |
Debug log messaging is not collected. To capture messages you want, change the relevant message severity to informational, error, alert, emergency, or notice level. |