Insights: Reclaim ONTAP Cold Storage
 Suggest changes
The Reclaim ONTAP Cold Storage Insight provides data about cold capacity, potential cost/power savings and recommended action items for volumes on ONTAP systems.
To view these Insights, navigate to Dashboards > Insights and take a look at the Reclaim ONTAP Cold Storage Insight. Note that this Insight will only list affected storages if Data Infrastructure Insights has detected cold storage, otherwise you will see an "all clear" message.
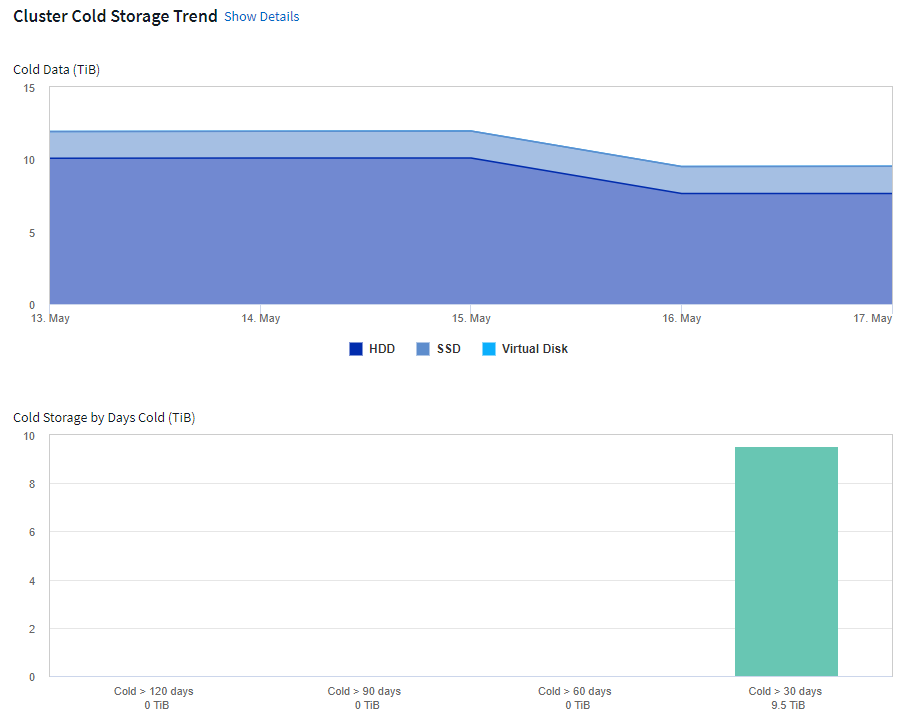
Keep in mind that cold data less than 30 days old is not shown.
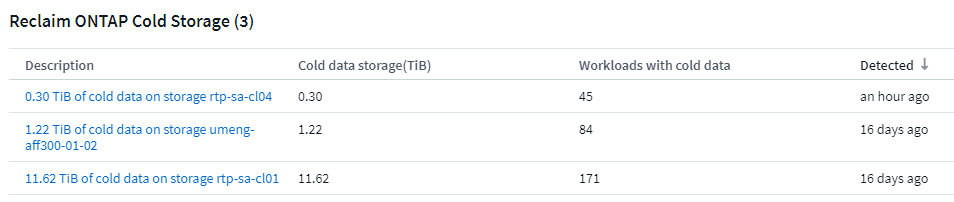
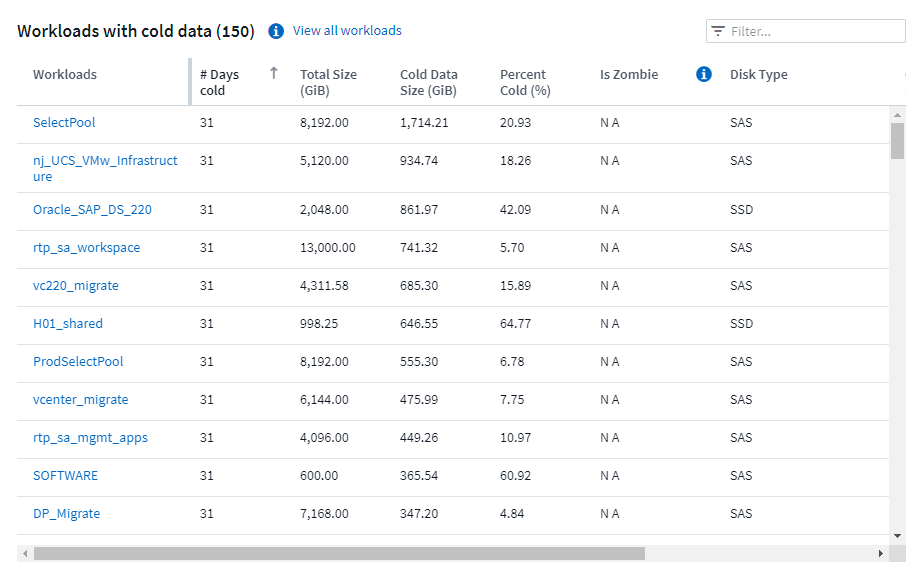
The Insight description gives a quick indication of the amount of data detected as "cold" and which storage that data resides on. The table also provides a count of workloads with cold data.
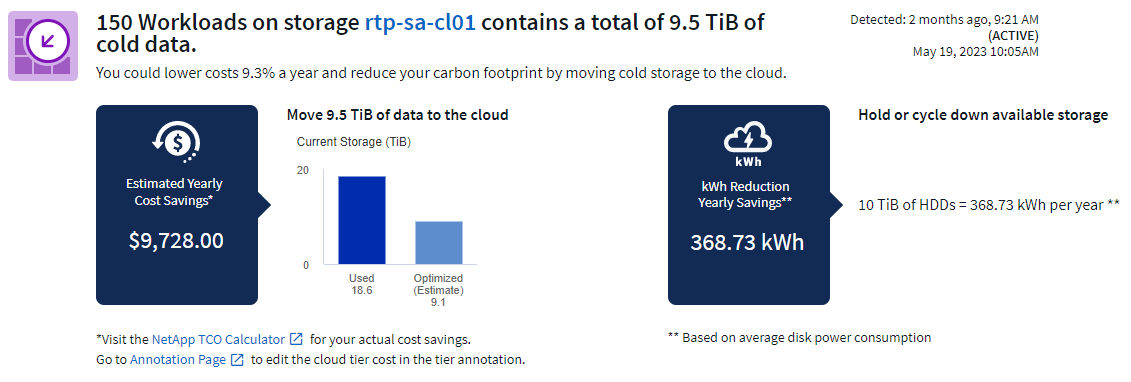
Selecting an Insight from the list opens a page showing more details, including recommendations to move data to the Cloud or cycle down unised disks, as well as estimated cost and power savings you could potentially realize from implementing those recommendations. The page even provides a handy link to NetApp's TCO Calculator so you can experiment with the numbers.
Recommendations
On the Insight page, expand the Recommendations to explore the following options:
-
Move unused workloads (zombies) to a lower cost storage tier (HDD)
Utilizing the zombie flag, cold storage and number of days, find the coldest and largest amount of data and move the workload to a lower cost storage tier (such as a storage pool using hard disk storage). A workload is considered a "zombie" when is has not received any significant IO requests for 30 days or more.
-
Delete unused workloads
Verify which workloads are not in use and consider archiving them or remove them from the storage system.
-
Consider NetApp's Fabric Pool Solution
NetApp's Fabric Pool Solution automatically tiers cold data to low cost cloud storage, thus increasing the effiecency of your performance tier as well as providing remote data protection.
Visualize and Explore
The graphs and table provide additional trending information as well as allow you to drill into the individual workloads.