Kubernetes Node Detail Page
 Suggest changes
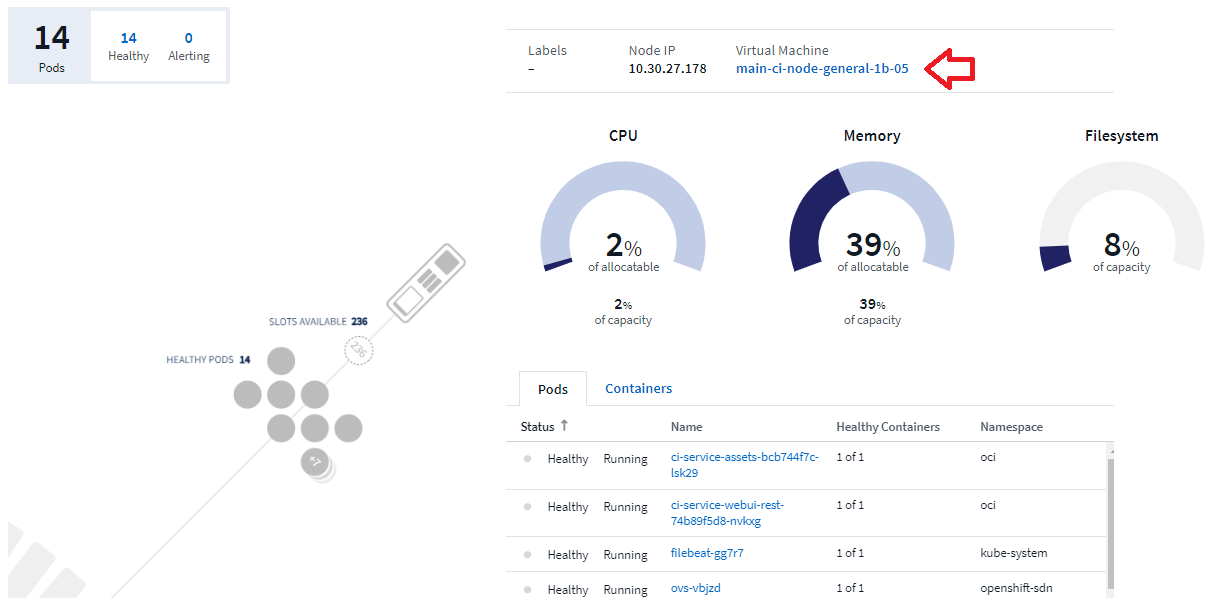
In the Kubernetes Explorer, you can click on a Node icon to open a detailed information page for that node. On this page you can view information about the node as well as explore VM, Pod, and Container information.
Exploring the Node's Pods and Persistent Volumes
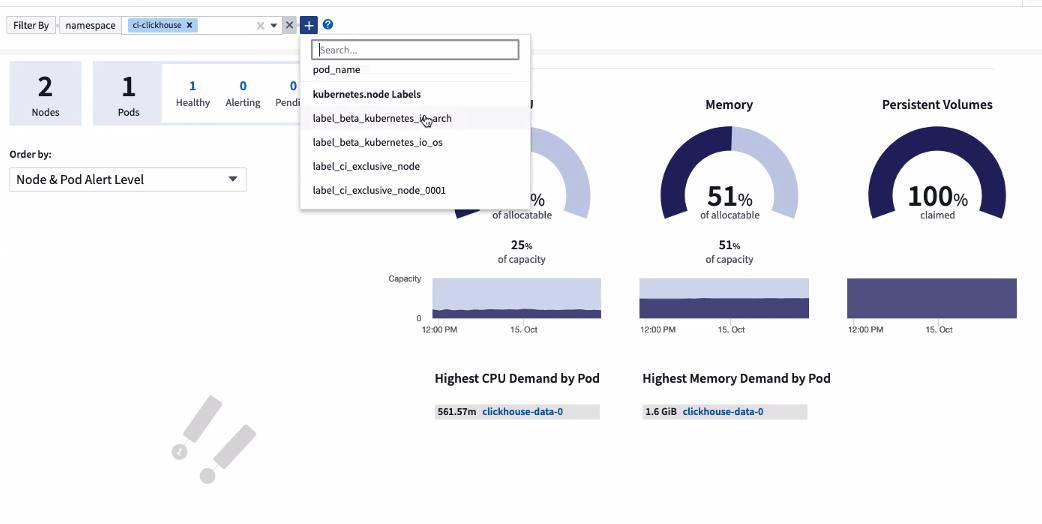
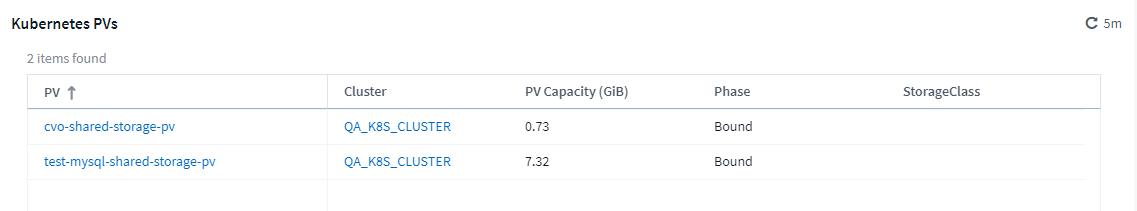
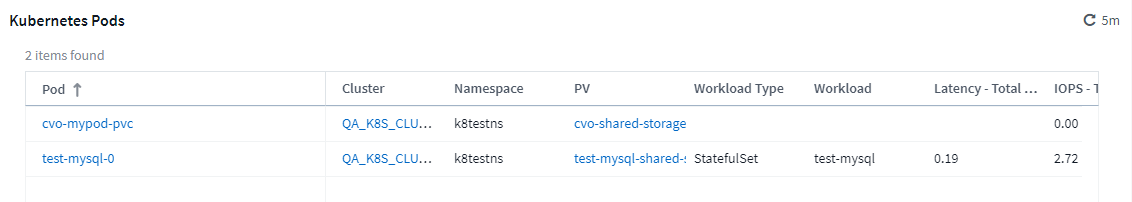
Data Infrastructure Insights provides visibility into the back-end storage for your Kubernetes environments, giving you insight to your Kubernetes Pods and Persistent Volumes (PVs). You can track PV counters such as IOPS, latency, and throughput from a single Pod’s usage through a PV counter to a PV and all the way to the back-end storage device.
At the PV level, Data Infrastructure Insights collects back-end (internal volume or volume depending on PV type) capacity information (total, used, used percent), as well as internal volume snapshot count. On the Pod to storage level it collects back-end capacity and internal volume snapshot count.
On a Volume or Internal Volume landing page, two tables are displayed:

|
If you have customized your Volume or Internal Volume landing page, you may not automatically see the PV and Pod tables. To see these tables, you must revert the page back to the default, at which point you will see the PV and Pod tables. You can then proceed to re-customize the page as desired. |
Note that to take advantage of these new tables, it is recommended to uninstall your current Kubernetes agent, and install it fresh. You must also install Kube-State-Metrics version 2.1.0 or later.
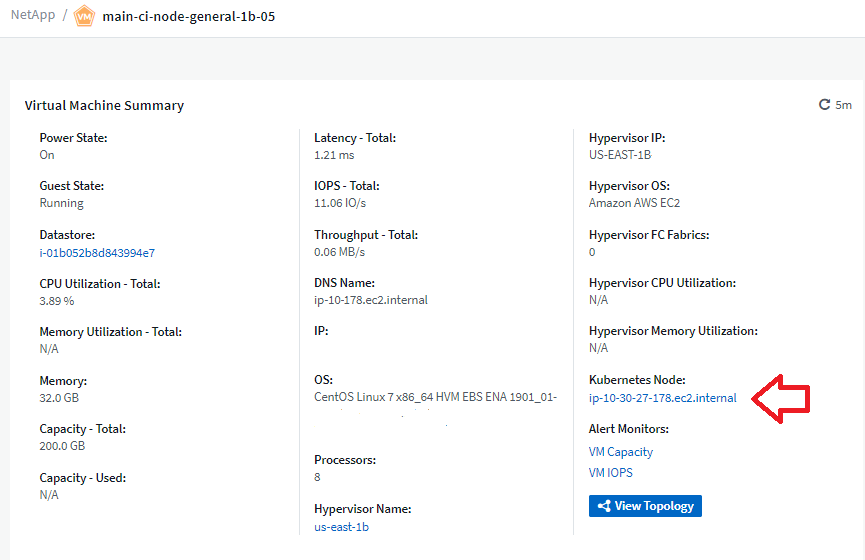
Kubernetes Node to VM links
On a Kubernetes Node page, you can click to open the Node's VM page. The VM page also includes a link back to the Node itself.