


Monitor and investigate alerts in NetApp Console local deployment


 Suggest changes

 PDFs
PDFs
Monitor and investigate alerts in NetApp Console local deployment to keep your storage healthy and minimize disruption.
View active alerts across your entire organization or a specific fleet, prioritize them by severity and impact area, and investigate root causes so you can resolve issues before they escalate. When an alert includes a recommended action or Fix It option, you can move from investigation directly into remediation.
All roles. Alerts are shown only for resources you are authorized to view. If you do not see a resource in the list of available resources, you do not have permission to view its alerts. Learn about access roles.
For ONTAP alerts, you can access tools such as System Manager and Workload Analyzer directly from the Alerts page to investigate and resolve issues.
For external reporting, you can export the alerts list to a CSV file for offline analysis.

|
Alerts are retained in NetApp Console local deployment for 7 days from the time they are raised. |
|
|
You can also set up notification rules to receive alerts by email or webhook. Learn how to set up alert notifications. |
Available alerts
NetApp Console local deployment supports alerts for ONTAP and NetApp Backup and Recovery.
View the alerts dashboard
Use the alerts dashboard to get a quick view of current alert activity for the scope you selected. The dashboard summarizes active alerts by severity and impact area, and it includes a chart that shows alert distribution over the past 24 hours so you can spot trends quickly.
You can filter the dashboard to focus on critical alerts or alerts for a specific impact area.
-
Select Health > Alerts > Overview.
-
From the scope selector, choose one of the following:
-
All (default) to see alerts across all fleets you have access to
-
A specific fleet to see alerts only for that fleet
-
-
Filter the dashboard according to the alerts you need to view, including:
-
Severity (Critical, Warning, or Informational)
-
Critical alerts grouped by impact area
-
Impact area (Availability, Capacity, Configuration, Performance, Protection, or Security)
-
Drift alerts to see only alerts caused by configuration drift
-
View all alerts
Use the Alerts tab to view the full list of active alerts for the scope you've selected. The list updates to reflect the current organization or fleet scope, and you can search the list for specific alerts by name or description.
-
Select Health > Alerts > Overview.
-
From the scope selector, choose one of the following:
-
All (default) to see alerts across all fleets you have access to
-
A specific fleet to see alerts only for that fleet
-
-
Select the Alerts tab to view the full list of active alerts for the selected scope.
-
Optionally, search the list for a specific alert by name or description.

View alerts by system
You can view alerts for a specific system within a fleet or your organization.
-
Select Health > Alerts > Overview.
-
From the scope selector, choose one of the following:
-
All (default) to see alerts across all fleets you have access to
-
A specific fleet to see alerts only for that fleet
-
-
Select the Systems health tab to view a summary of the alerts associated with the systems within the scope you've selected.
-
Select View alerts on the row of the respective system to view the full list of active alerts associated with that system.
Investigate an alert
You can investigate an alert to see what triggered it.
When investigating an ONTAP alert, you can also go directly to the System Manager interface for the system that generated the alert to view additional details and take action.
-
Select Health > Alerts > Overview.
-
From the scope selector, choose one of the following:
-
All (default) to see alerts across all fleets you have access to
-
A specific fleet to see alerts only for that fleet
-
-
In either tab, select the name of the alert you want to investigate to view its details.

-
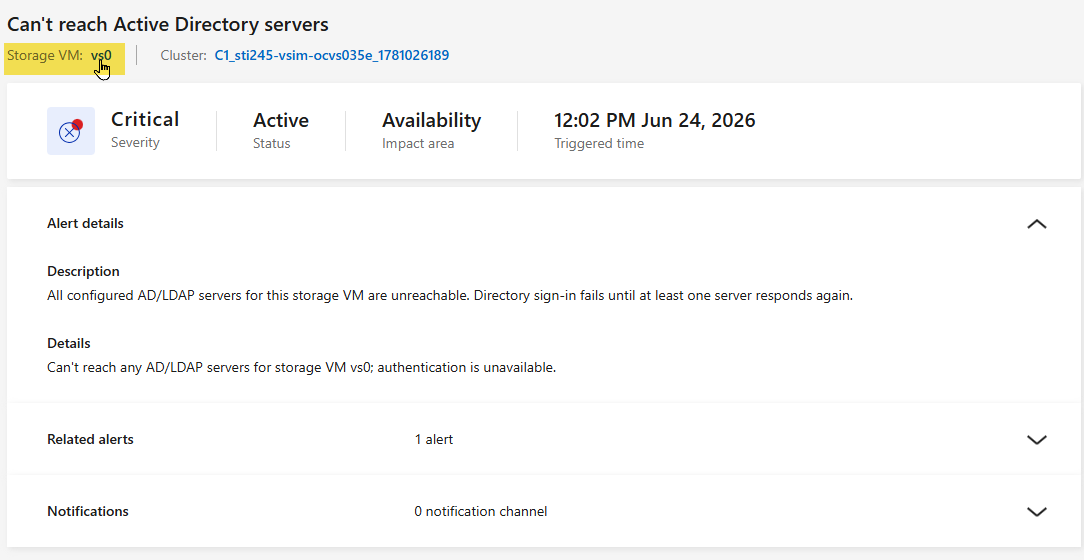
If applicable, select the VM or cluster name to open the System Manager interface for the system that generated the alert.
Remediate an alert
When an alert includes a recommended action or Fix It option, use it to move from investigation into remediation without leaving the alert details.
-
Select Health > Alerts > Overview.
-
From the scope selector, choose one of the following:
-
All (default) to see alerts across all fleets you have access to
-
A specific fleet to see alerts only for that fleet
-
-
Select the alert you want to remediate.
-
Review the alert details, then select the recommended action or Fix It option if one is available.
-
Follow the guided steps to apply the remediation and then return to the alert details to confirm the alert state.
If the action resolves the issue, the alert no longer appears as active for that scope. If the alert remains active, review the alert details again and continue the investigation.
Analyze an alert
You can analyze an ONTAP alert in Workload Analyzer to understand what triggered it.
Use Workload Analyzer for detailed, time-based analysis of the affected volume. For natural-language questions or high-level analysis across permitted resources, use the Console assistant.
Learn about supported Console assistant operations.
When investigating an ONTAP alert, you can also go directly to the System Manager interface for the system that generated the alert to view additional details and take action.
-
Select Health > Alerts > Overview.
-
From the scope selector, choose one of the following:
-
All (default) to see alerts across all fleets you have access to
-
A specific fleet to see alerts only for that fleet
-
-
Select the Systems health tab to view the full list of active alerts for the selected scope.
-
In either tab, select the name of the alert you want to investigate to view its details.
-
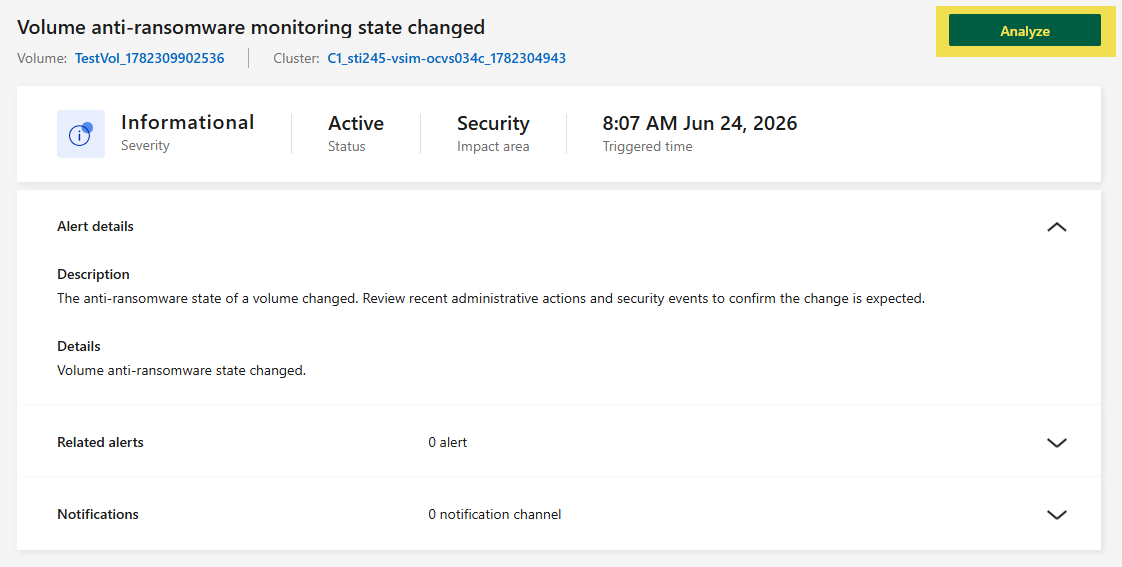
If applicable, select Analyze to open the Workload Analyzer interface for the system that generated the alert.
-
Enter the time range that covers the period when the alert was triggered, then select Analyze to view the analysis results. Learn about Workload Analyzer.
Export alerts to CSV
Export the alerts list in the NetApp Console local deployment to a CSV file for offline analysis or reporting. The export reflects the current scope (organization or fleet), search text, and filters.
-
Select Health > Alerts and then select the Alerts tab.
-
Set the scope (organization or fleet) and apply any filters or search text you want included in the export.
-
Select the download icon to export the alerts list to a CSV file.