

Asset Page Overview
 Suggest changes
Asset landing pages summarize the current status of an asset and contain links to additional information about the asset and its related assets.
Landing pages give you a single-page view of the object, with Summary, Performance, and Related Resource information.
Summary Section
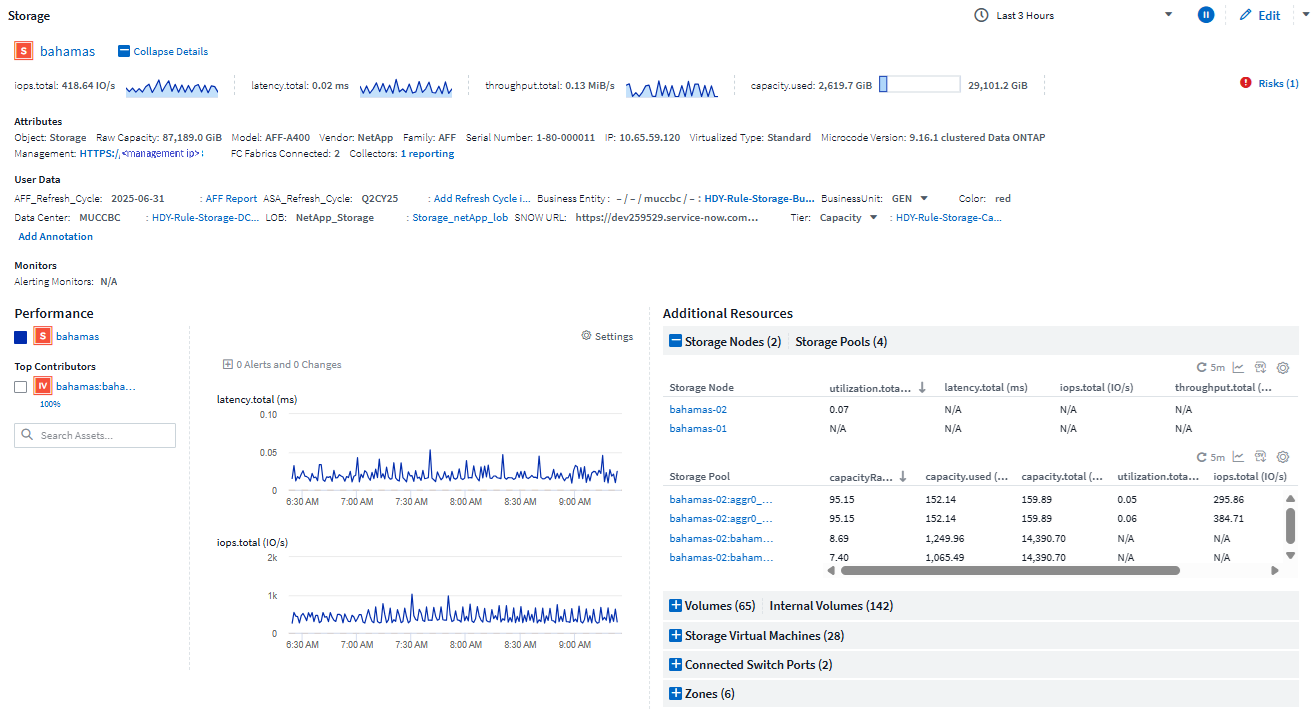
At the top of a landing page is the expandible Summary section, which includes several sparkline graphs displaying recent data trends for things like throughput or latency, as well as object information and attributes, and any monitors that may be alerting for the object.
The Summary section also displays and enables you to change annotations assigned to the asset.
Performance Section
The Performance Section displays performance data for the object. Select Settings to add additional charts to the display like Throughput or Capacity, or select correlated or contributing resources to chart their data alongside the object's. Devices that may potentially be causing contention will also be listed in the Performance section. The data in the charts refreshes automatically as data collectors poll and updated data is acquired.
You can select the metrics you want to view in the performance chart for the time period selected. Click on the Settings drop-down and choose from the metrics listed.
In addition to performance data, any alerts that are or were active within the selected page time range will also be shown.
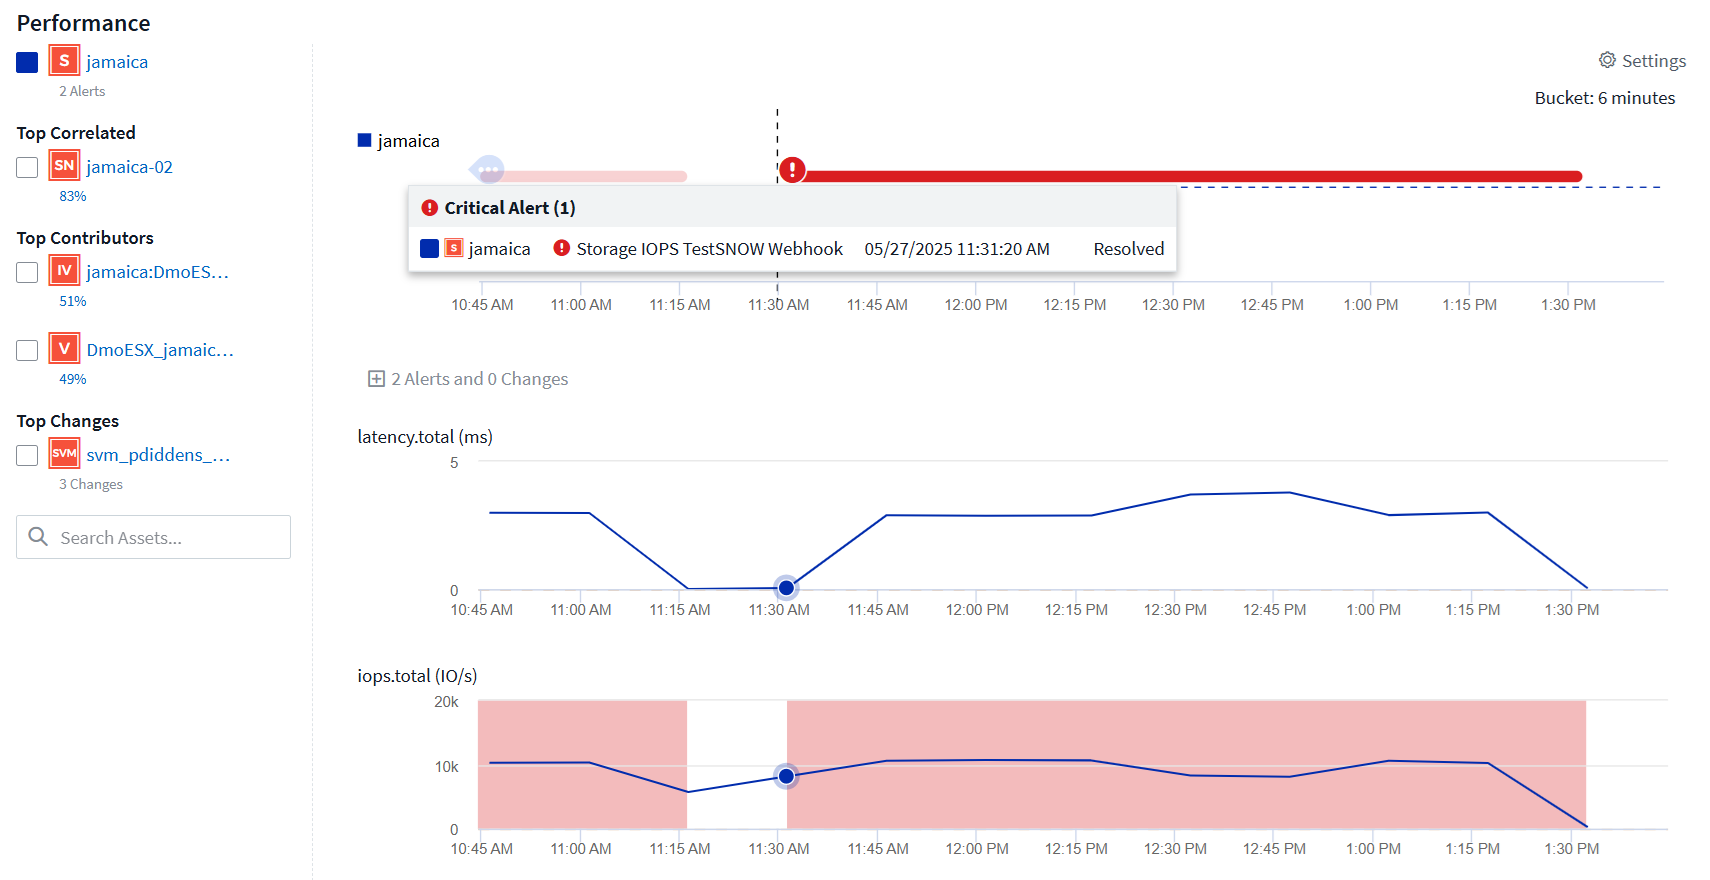
You can select from among the following devices that may be listed in the Performance section:
-
Top correlated
Shows the assets that have a high correlation (percentage) with one or more performance metrics to the base asset.
-
Top contributors
Shows the assets that contribute (percentage) to the base asset.
-
Top Changes
Assets related to recent changes.
-
Workload Contentions
Shows the assets that impact or are impacted by other shared resources, such as hosts, networks, and storage. These are sometimes called greedy and degraded resources.
Additional Resources Section
The Additional Resources section displays tables of data for resources related to the current object type. You can expand and collapse these tables in order to focus on specific resources. Select the gear icon to temporarily show additional metrics or attributes in a table.
Add Custom Widgets
You can add your own widgets to any asset page. Widgets you add will appear on asset pages for all objects of that type. For example, adding a custom widget to a storage asset page will display that widget on asset pages for all storage assets.
Custom widgets are placed at the bottom of a landing page, below the Performance and Resource sections.
Types of Asset Pages
Data Infrastructure Insights provides asset pages for the following assets:
-
Virtual machine
-
Storage Virtual Machine (SVM)
-
Volume
-
Internal volume
-
Host (including Hypervisor)
-
Storage pool
-
Storage
-
Datastore
-
Application
-
Storage node
-
Qtree
-
Disk
-
VMDK
-
Port
-
Switch
-
Fabric
-
Host
-
Zone
Changing the Time Range of Displayed Data
By default, an asset page displays the last 3 hours of data; however, you can change the time segment of displayed data by using an option that is located on every asset page, regardless of asset type. To change the time range, click the displayed time range in the top bar and choose from among the following time segments:
-
Last 15 Minutes
-
Last 30 Minutes
-
Last 60 Minutes
-
Last 2 Hours
-
Last 3 Hours (this is the default)
-
Last 6 Hours
-
Last 12 Hours
-
Last 24 Hours
-
Last 2 Days
-
Last 3 Days
-
Last 7 Days
-
Last 14 Days
-
Last 30 Days
-
Custom time range
The Custom time range allows you to select up to 31 consecutive days. You can also set the Start Time and End Time of day for this range. The default Start Time is 12:00 AM on the first day selected and the default End Time is 11:59 PM on the last day selected. Clicking Apply will apply the custom time range to the asset page.
The information on the page refreshes automatically based on the selected time range. The current refresh rate is displayed in the upper-right corner of the Summary section as well as on any relevant tables or widgets on the page.
Performance metric definitions
The Performance section can display several metrics based on the time period selected for the asset. Each metric is displayed in its own performance chart. You can add or remove metrics and related assets from the charts depending on what data you want to see; the metrics you can choose from vary depending on asset type.
Metric |
Description |
BB credit zero Rx, Tx |
Number of times the receive/transmit buffer-to-buffer credit count transitioned to zero during the sampling period. This metric represents the number of times the attached port had to stop transmitting because this port was out of credits to provide. |
BB credit zero duration Tx |
Time in milliseconds during which the transmit BB credit was zero during the sampling interval. |
Cache hit ratio (Total, Read, Write) % |
Percentage of requests that result in cache hits. The higher the number of hits versus accesses to the volume, the better is the performance. This column is empty for storage arrays that do not collect cache hit information. |
Cache utilization (Total) % |
Total percentage of cache requests that result in cache hits |
Class 3 discards |
Count of Fibre Channel Class 3 data transport discards. |
CPU utilization (Total) % |
Amount of actively used CPU resources, as a percentage of total available (over all virtual CPUs). |
CRC error |
Number of frames with invalid cyclic redundancy checks (CRCs) detected by the port during the sampling period |
Frame rate |
Transmit frame rate in frames per second (FPS) |
Frame size average (Rx, Tx) |
Ratio of traffic to frame size. This metric enables you to identify whether there are any overhead frames in the fabric. |
Frame size too long |
Count of Fibre Channel data transmission frames that are too long. |
Frame size too short |
Count of Fibre Channel data transmission frames that are too short. |
I/O density (Total, Read, Write) |
Number of IOPS divided by used capacity (as acquired from the most recent inventory poll of the data source) for the Volume, Internal Volume or Storage element. Measured in number of I/O operations per second per TB. |
IOPS (Total, Read, Write) |
Number of read/write I/O service requests passing through the I/O channel or a portion of that channel per unit of time (measured in I/O per sec) |
IP throughput (Total, Read, Write) |
Total: Aggregated rate at which IP data was transmitted and received in megabytes per second. |
Read: IP Throughput (Receive): |
Average rate at which IP data was received in megabytes per second. |
Write: IP Throughput (Transmit): |
Average rate at which IP data was transmitted in megabytes per second. |
Latency (Total, Read, Write) |
Latency (R&W): Rate at which data is read or written to the virtual machines in a fixed amount of time. The value is measured in megabytes per second. |
Latency: |
Average response time from the virtual machines in a data store. |
Top Latency: |
The highest response time from the virtual machines in a data store. |
Link failure |
Number of link failures detected by the port during the sampling period. |
Link reset Rx, Tx |
Number of receive or transmit link resets during the sampling period. This metric represents the number of link resets that were issued by the attached port to this port. |
Memory utilization (Total) % |
Threshold for the memory used by the host. |
Partial R/W (Total) % |
Total number of times that a read/write operation crosses a stripe boundary on any disk module in a RAID 5, RAID 1/0, or RAID 0 LUN Generally, stripe crossings are not beneficial, because each one requires an additional I/O. A low percentage indicates an efficient stripe element size and is an indication of improper alignment of a volume (or a NetApp LUN). For CLARiiON, this value is the number of stripe crossings divided by the total number of IOPS. |
Port errors |
Report of port errors over the sampling period/given time span. |
Signal loss count |
Number of signal loss errors. If a signal loss error occurs, there is no electrical connection, and a physical problem exists. |
Swap rate (Total Rate, In rate, Out rate) |
Rate at which memory is swapped in, out, or both from disk to active memory during the sampling period. This counter applies to virtual machines. |
Sync loss count |
Number of synchronization loss errors. If a synchronization loss error occurs, the hardware cannot make sense of the traffic or lock onto it. All the equipment might not be using the same data rate, or the optics or physical connections might be of poor quality. The port must resynchronize after each such error, which impacts system performance. Measured in KB/sec. |
Throughput (Total, Read, Write) |
Rate at which data is being transmitted, received, or both in a fixed amount of time in response to I/O service requests (measured in MB per sec). |
Timeout discard frames - Tx |
Count of discarded transmit frames caused by timeout. |
Traffic rate (Total, Read, Write) |
Traffic transmitted, received, or both received during the sampling period, in mebibytes per second. |
Traffic utilization (Total, Read, Write) |
Ratio of traffic received/transmitted/total to receive/transmit/total capacity, during the sampling period. |
Utilization (Total, Read, Write) % |
Percentage of available bandwidth used for transmission (Tx) and reception (Rx). |
Write pending (Total) |
Number of write I/O service requests that are pending. |