Data Infrastructure Insights Reporting Schema Diagrams
Contributors

 Suggest changes
This document provides schema diagrams for the Reporting Database.

|
The Reporting feature is available in Data Infrastructure Insights Premium Edition. |
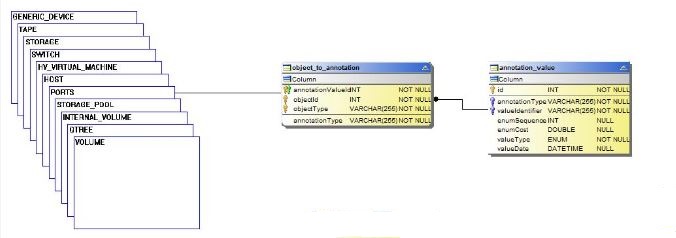
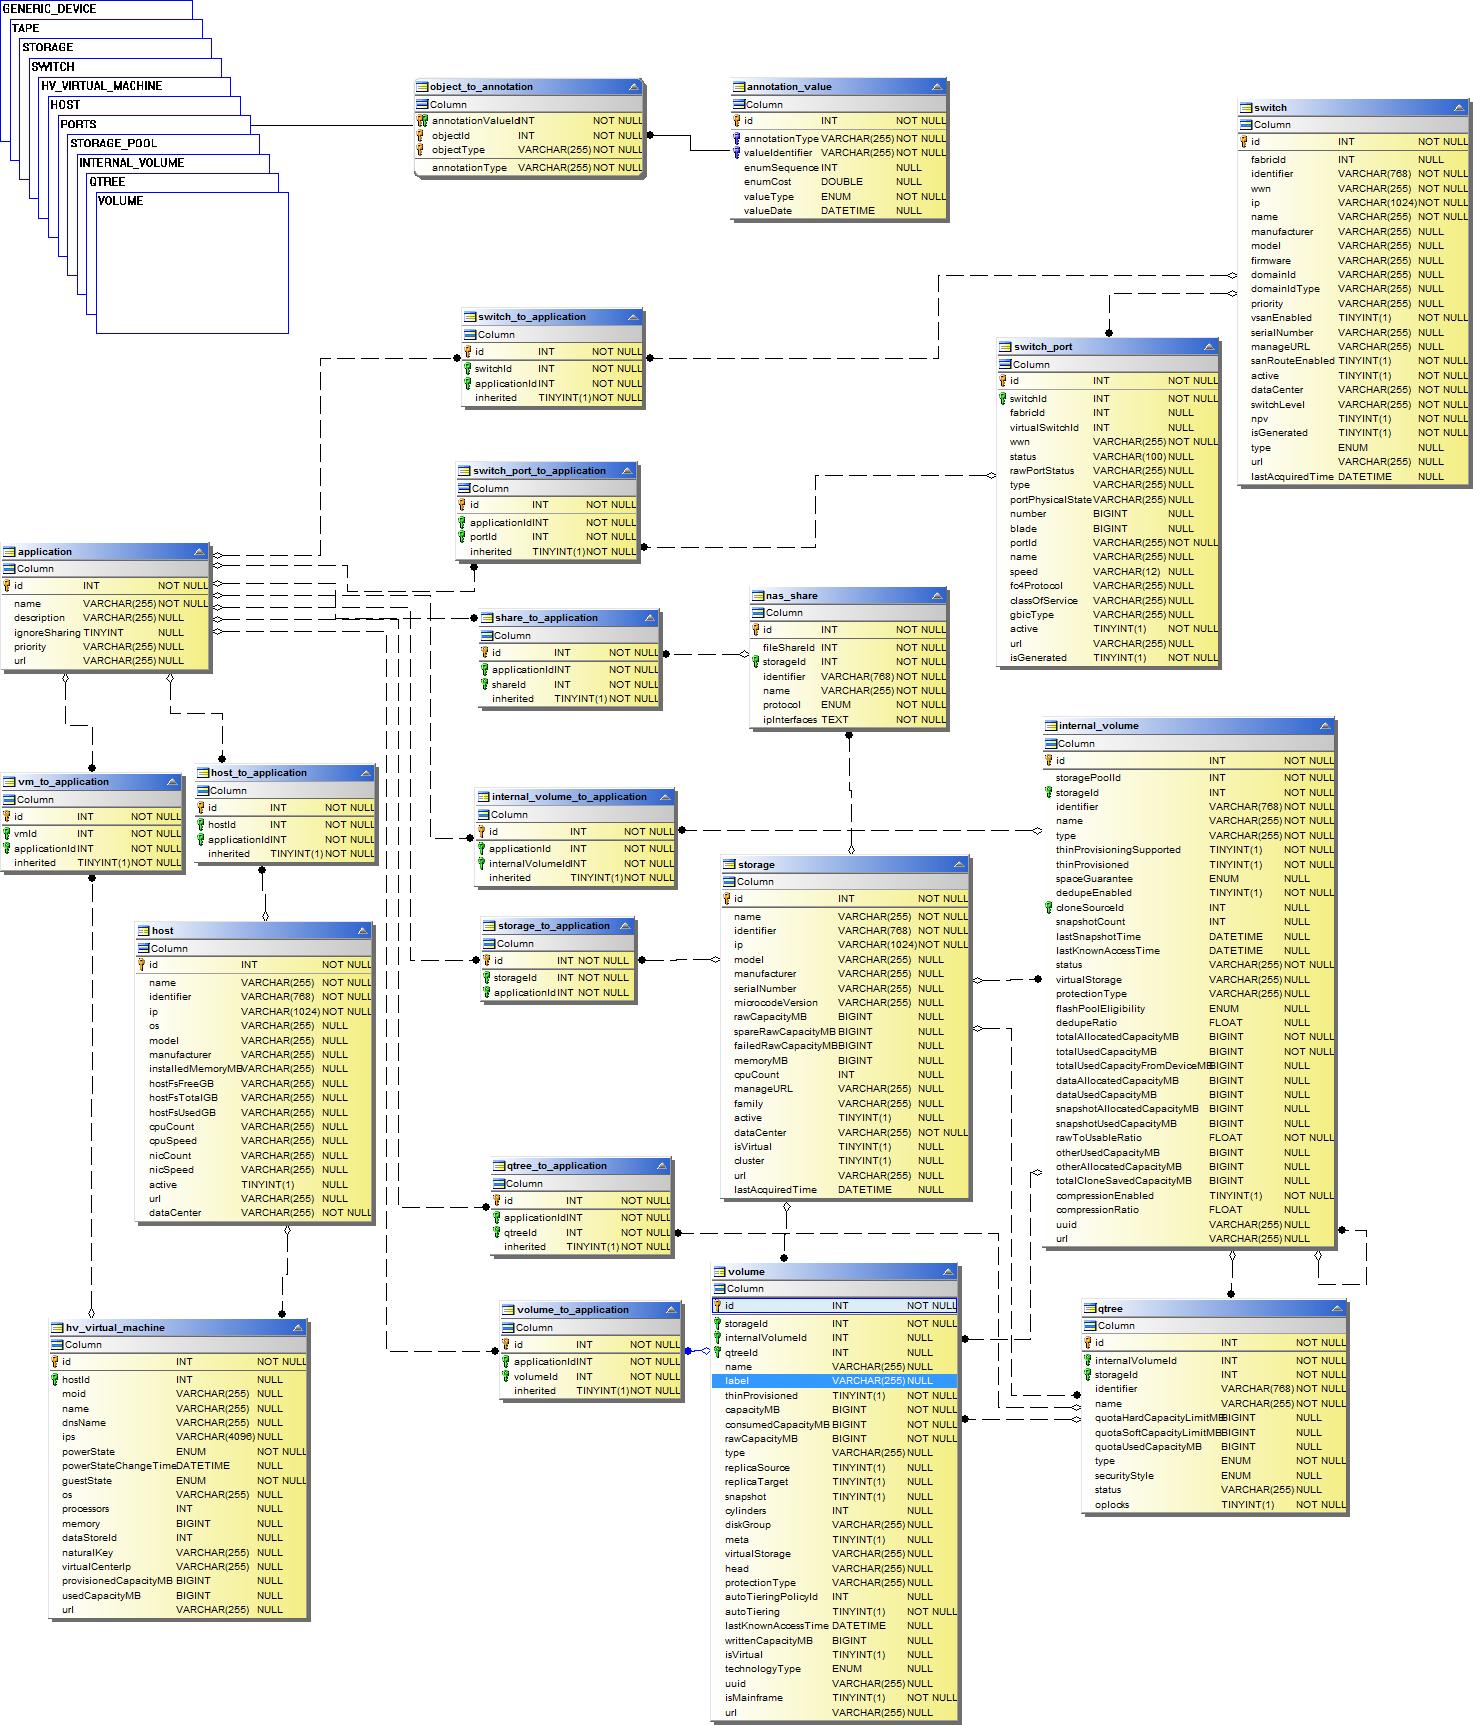
Inventory Datamart
The following images describe the inventory datamart.
Annotations
Applications
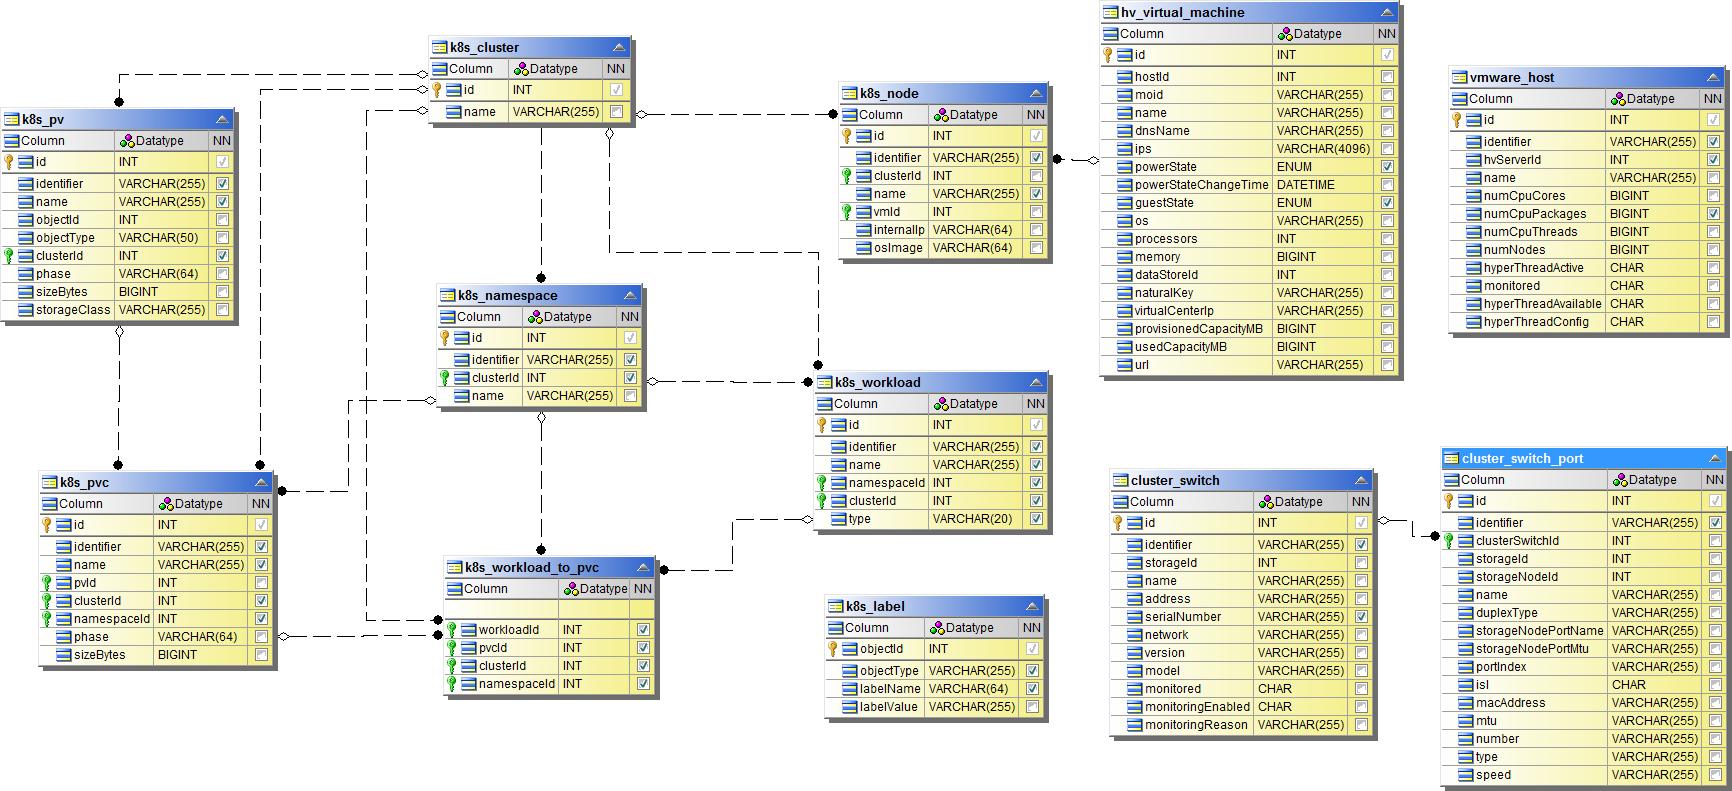
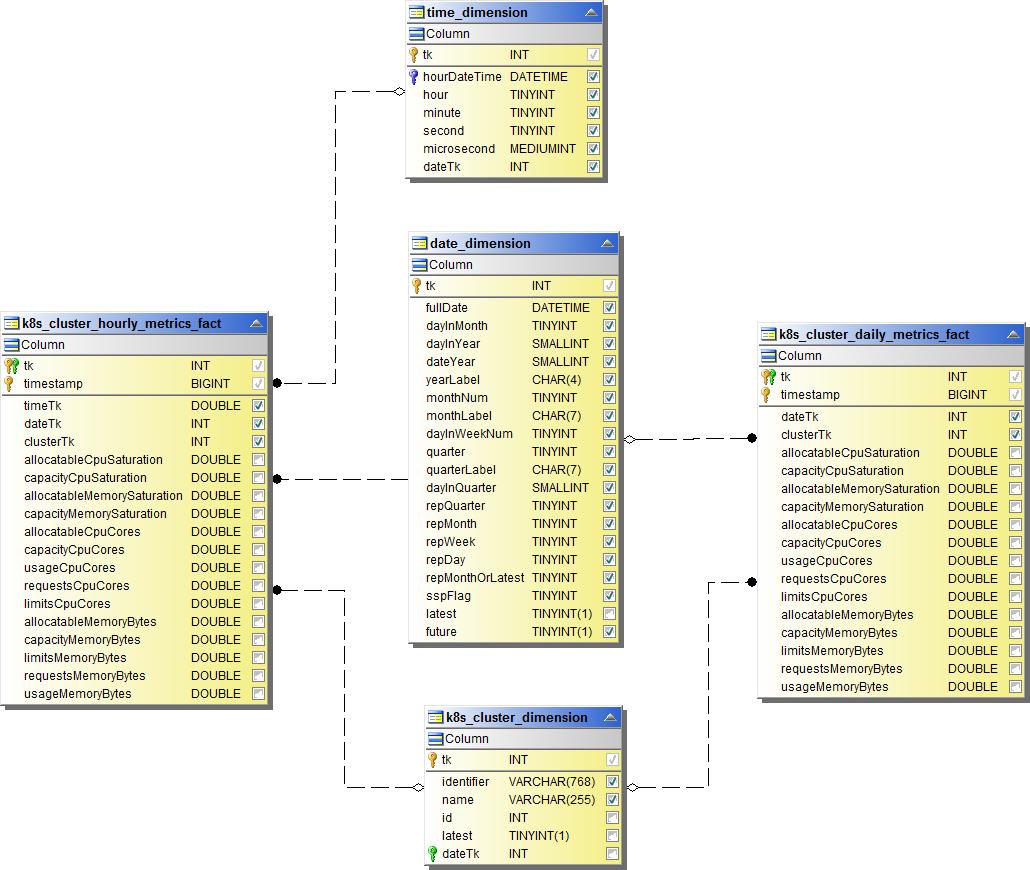
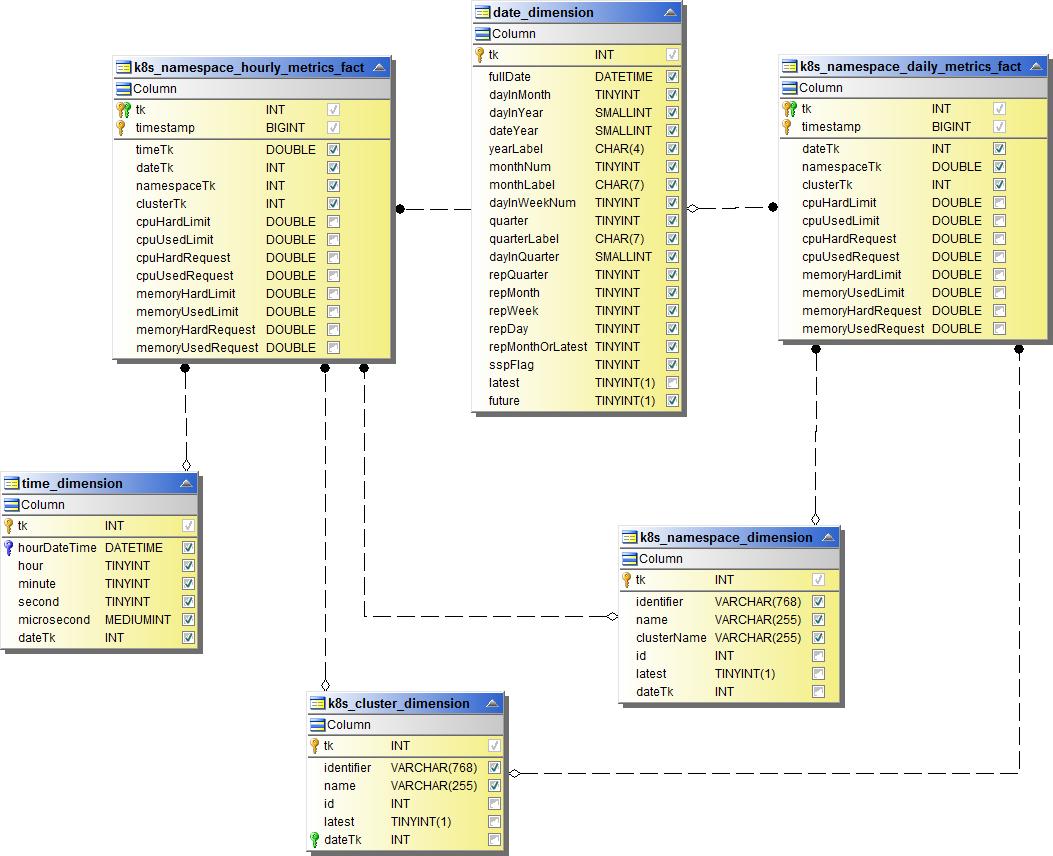
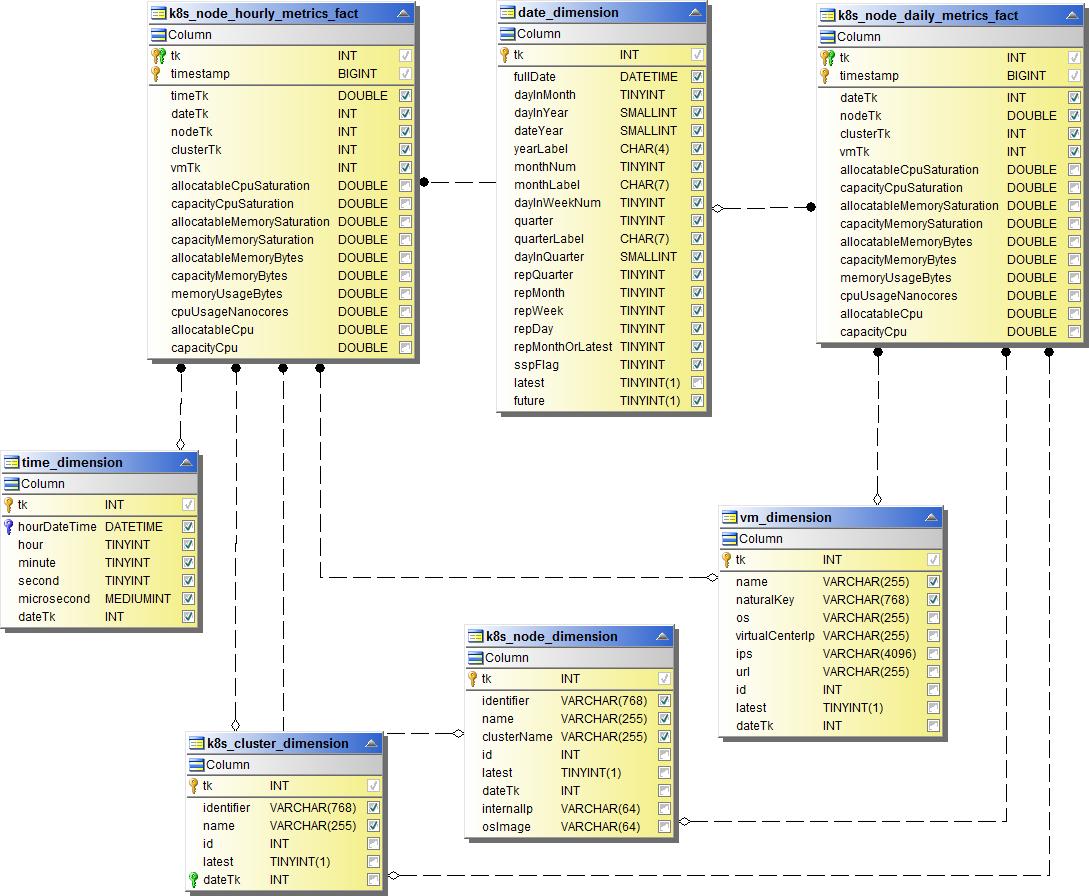
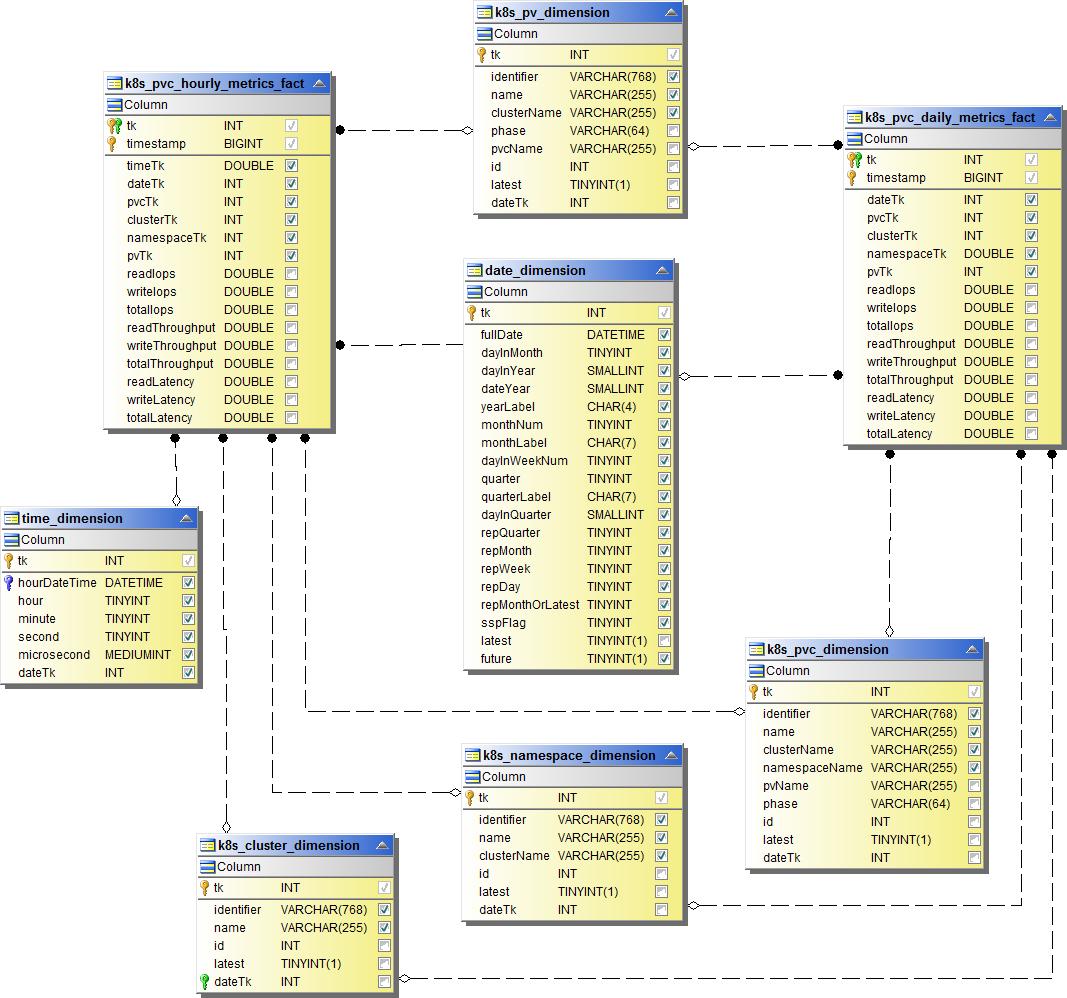
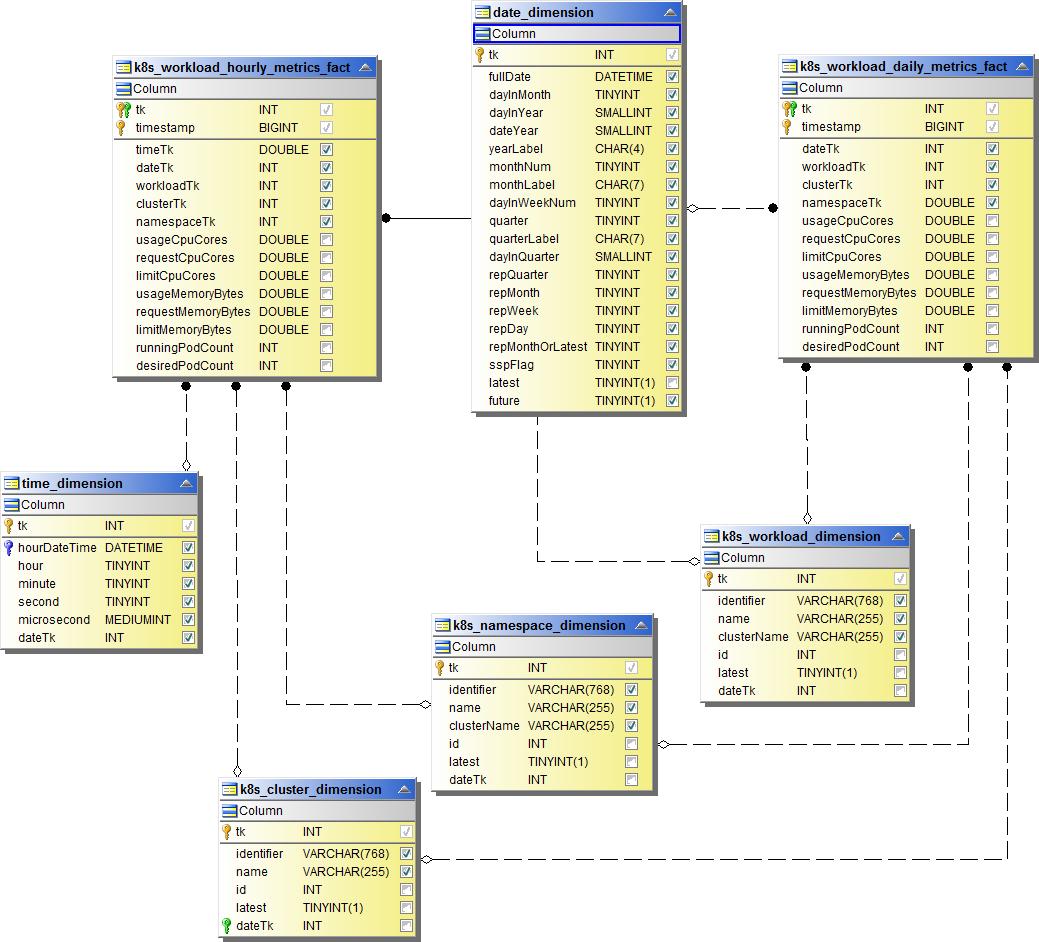
Kubernetes Metrics
Kubernetes Cluster Metrics Fact
Kubernetes Namespace Metrics Fact
Kubernetes Node Metrics Fact
Kubernetes PVC Metrics Fact
Kubernetes Workload Metrics Fact
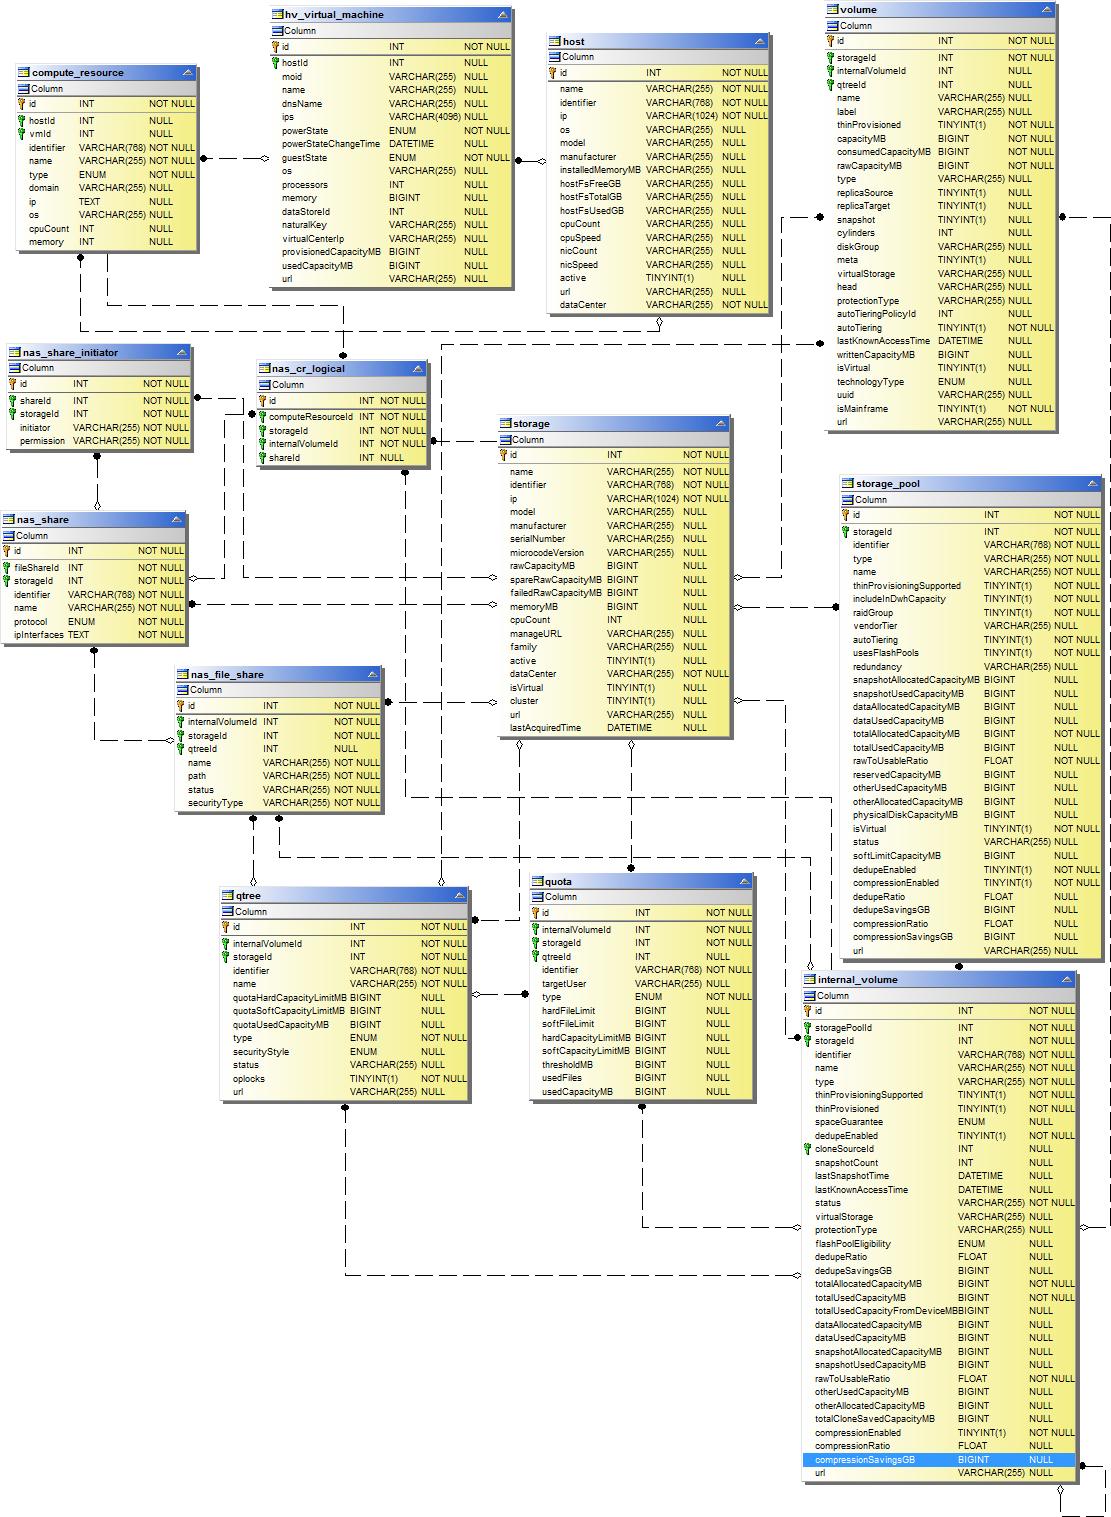
NAS
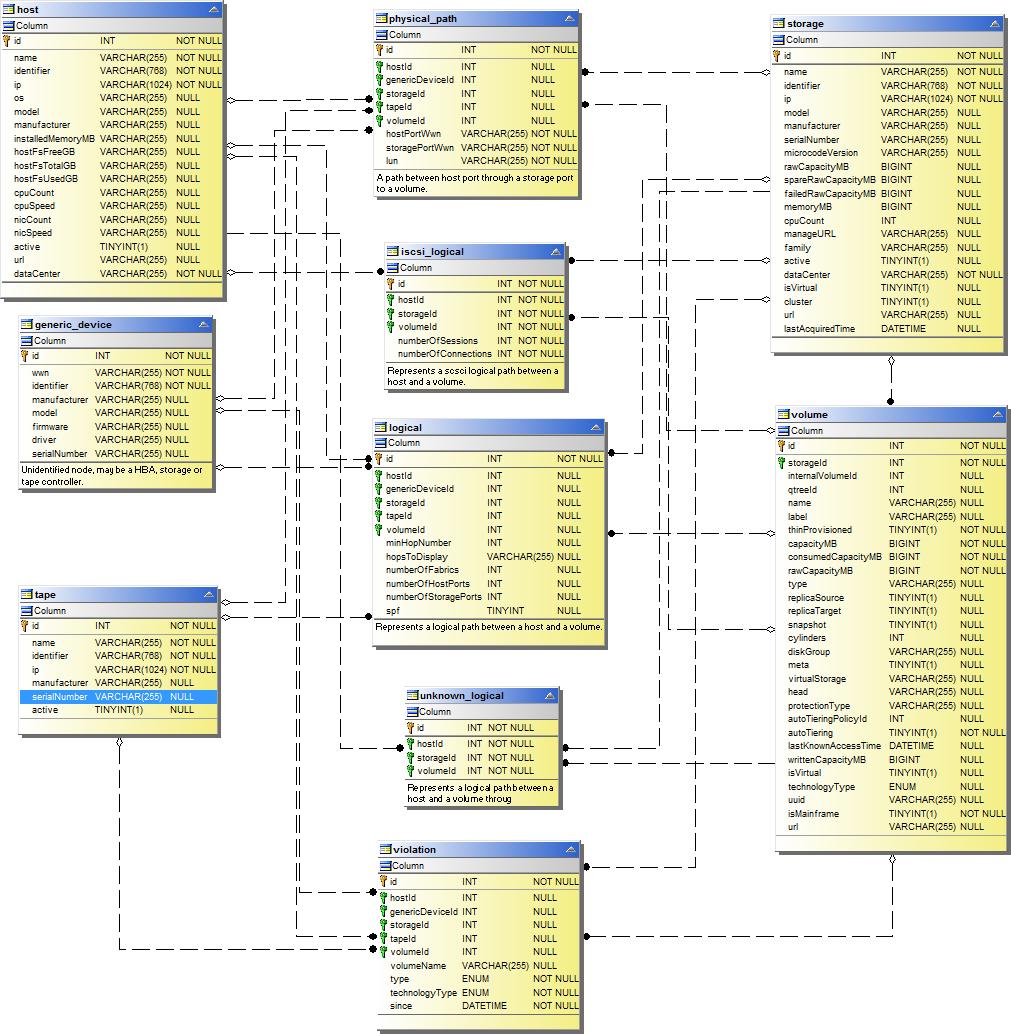
Paths and Violations
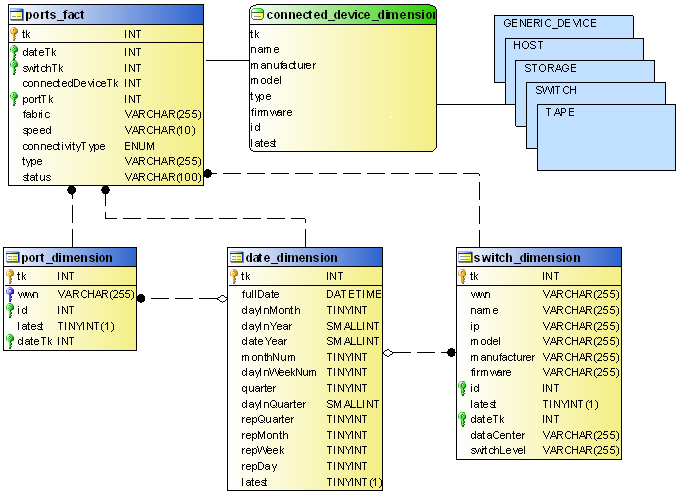
Port Connectivity
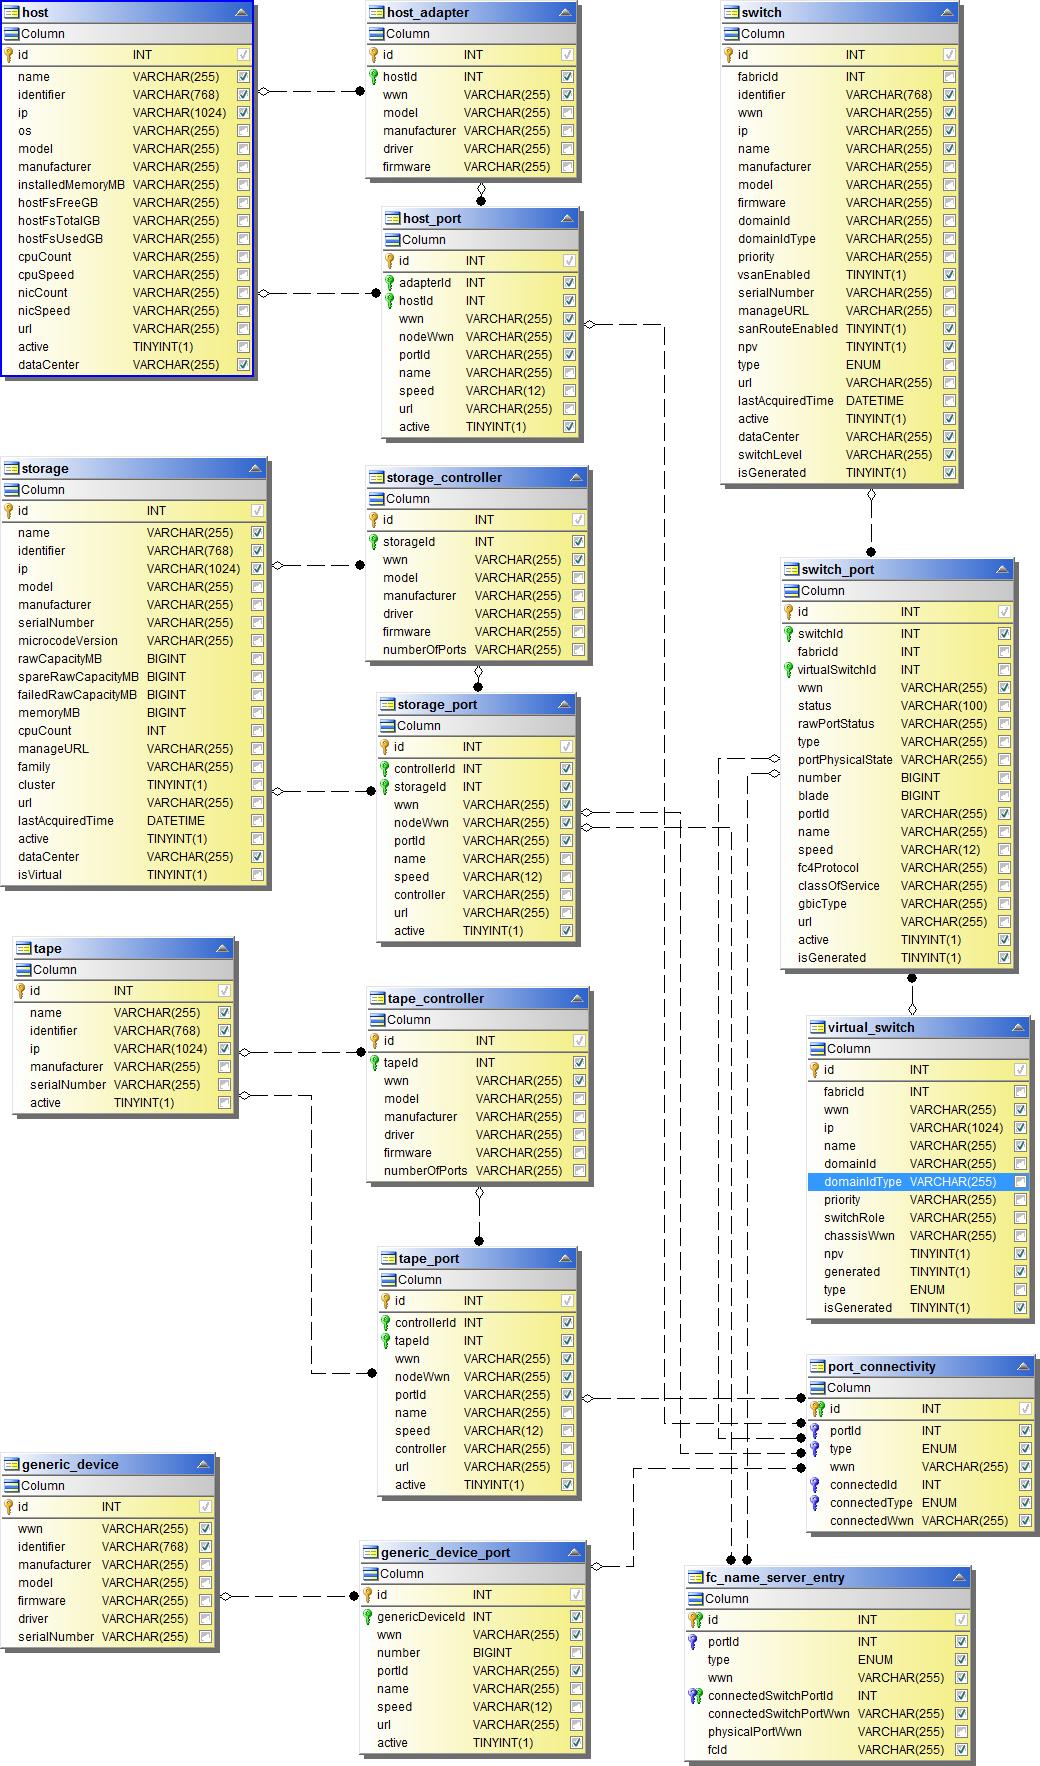
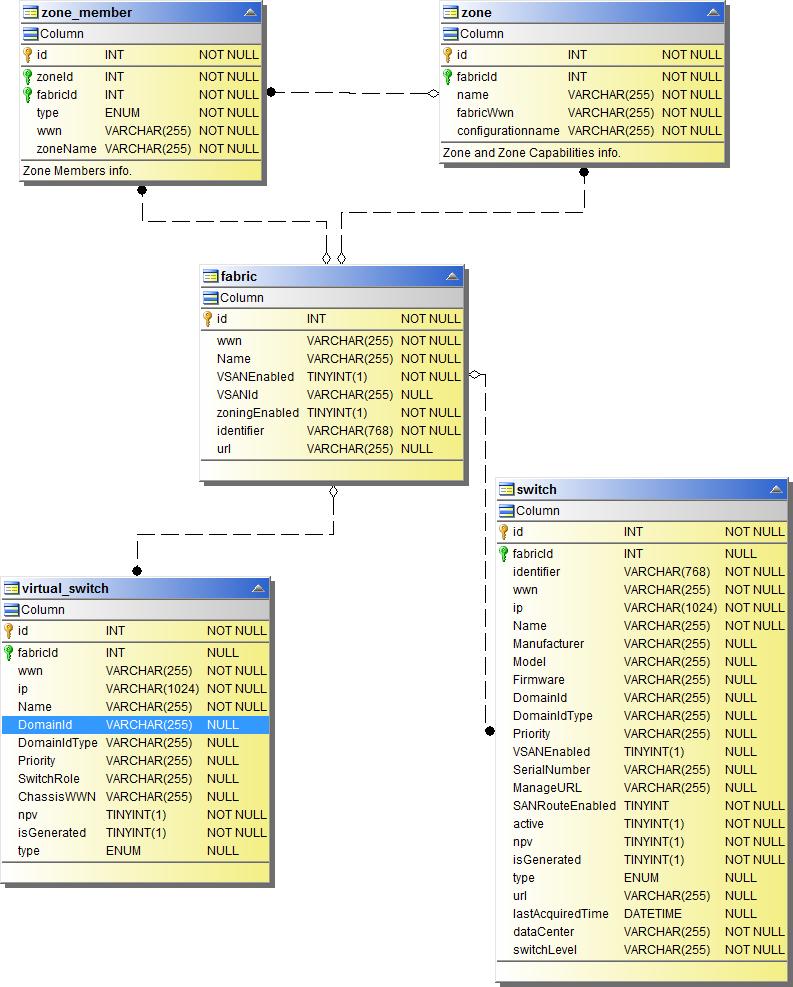
SAN Fabric
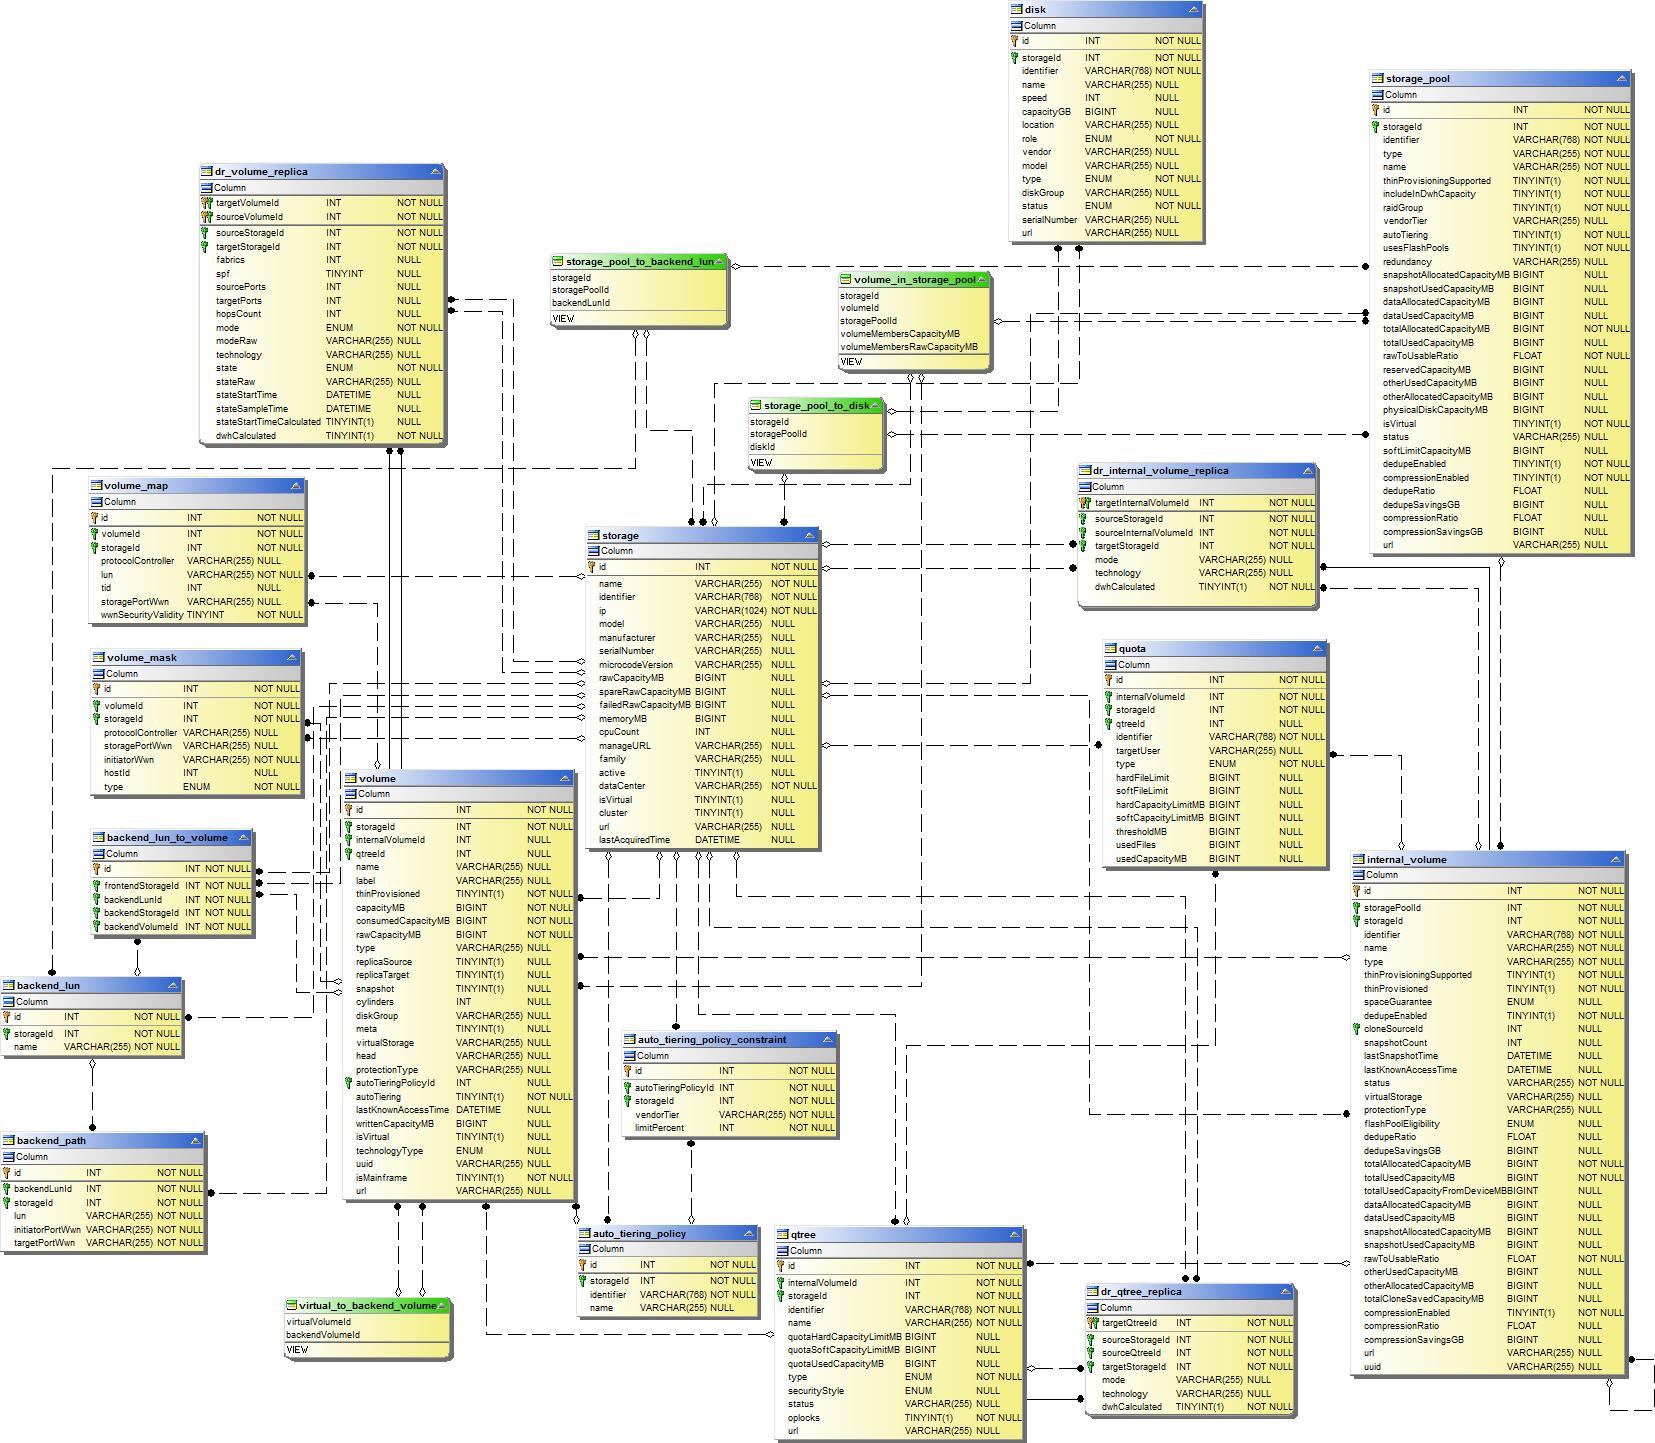
Storage
Storage Node

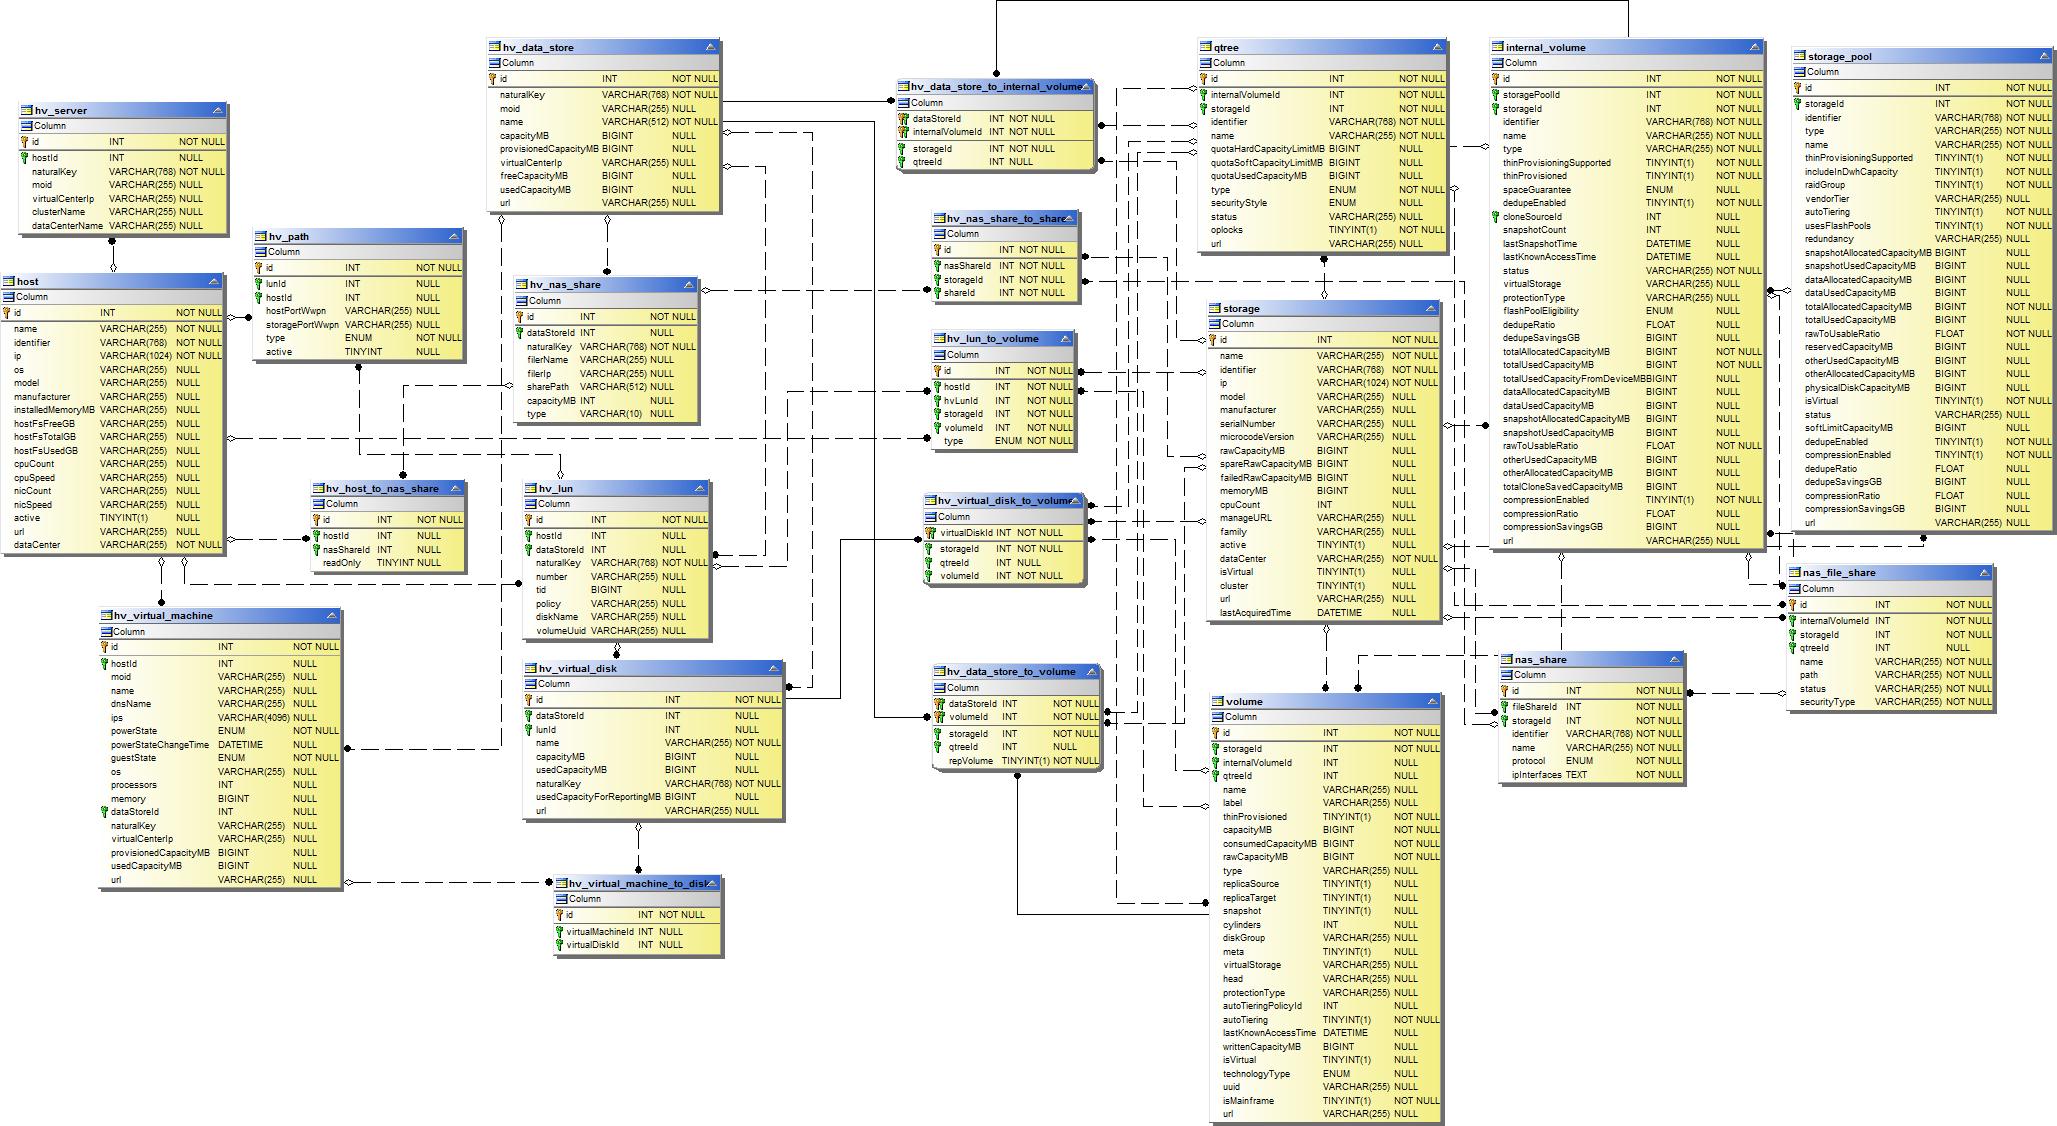
VM
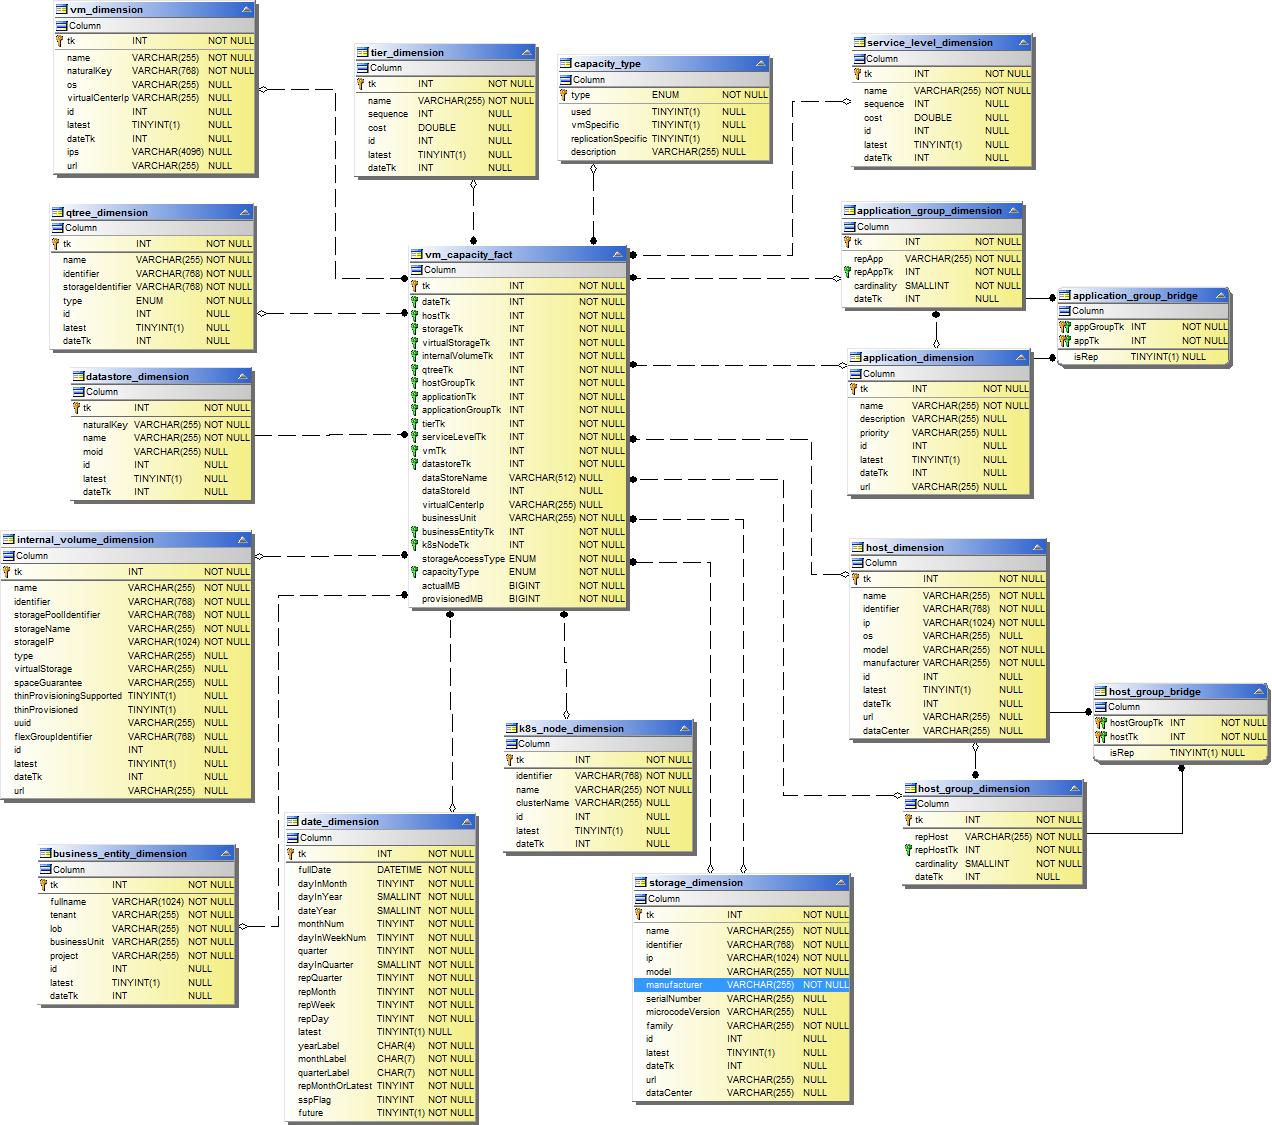
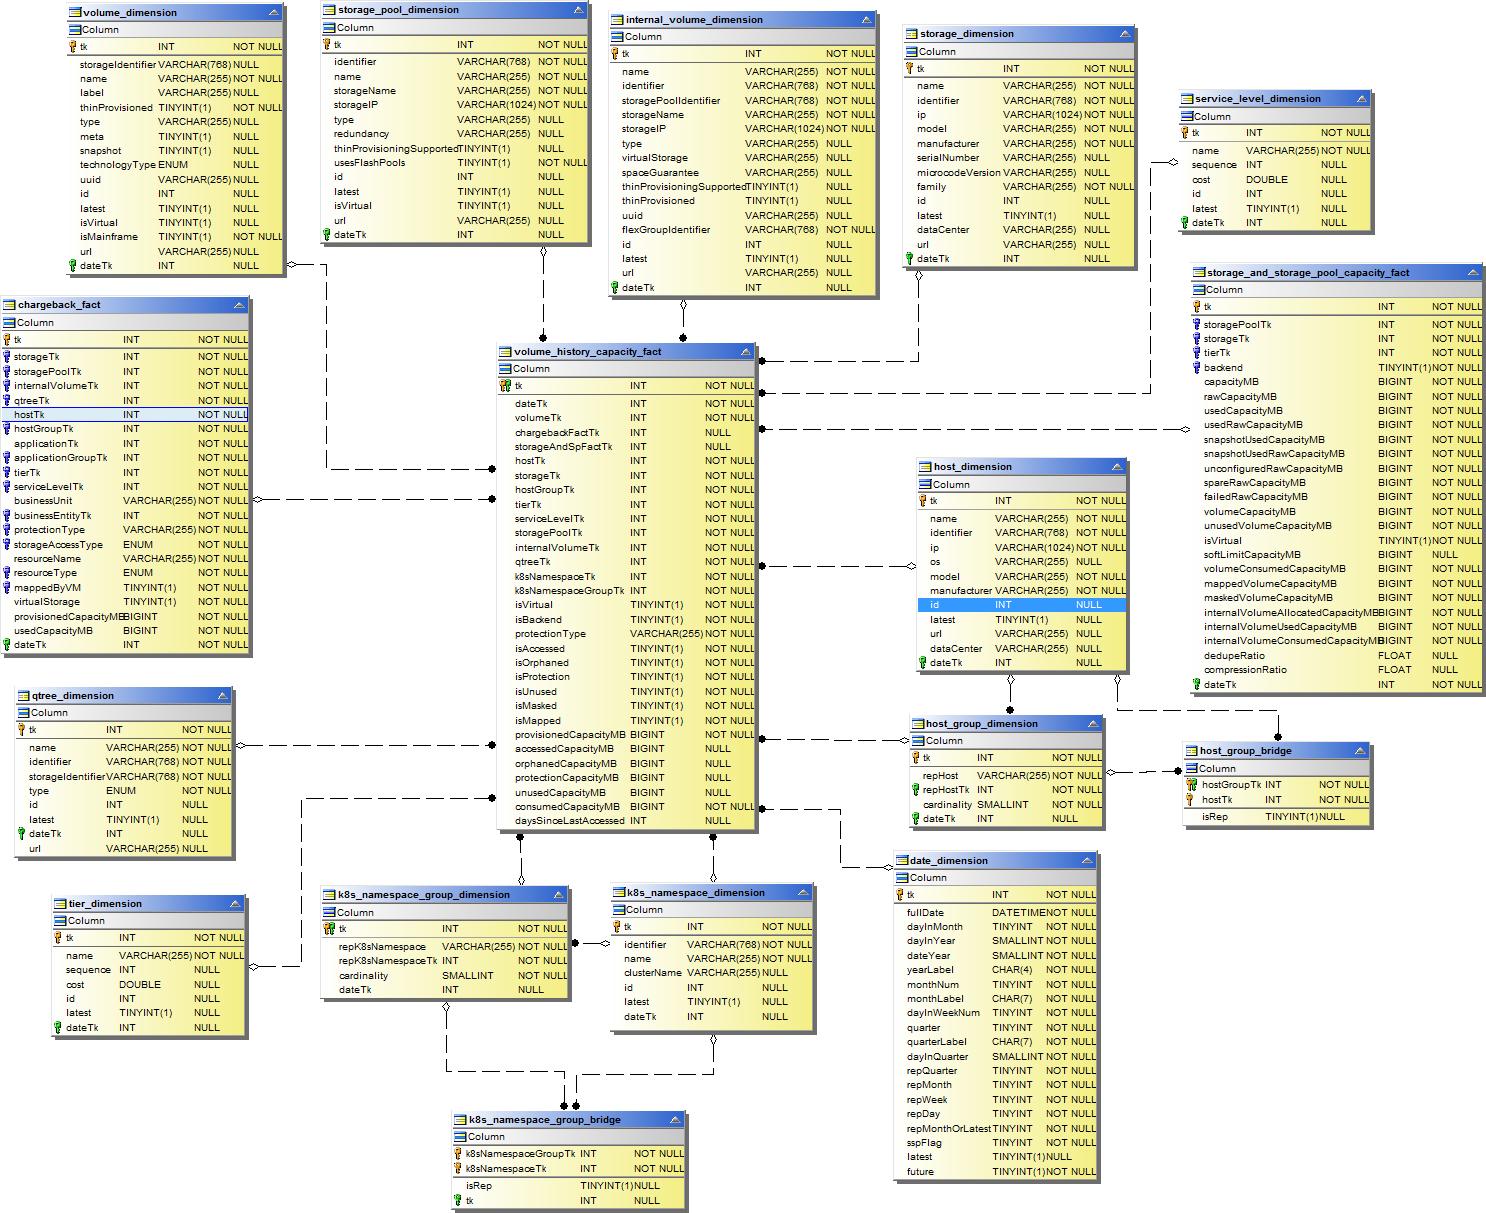
Capacity Datamart
The following images describe the capacity datamart.
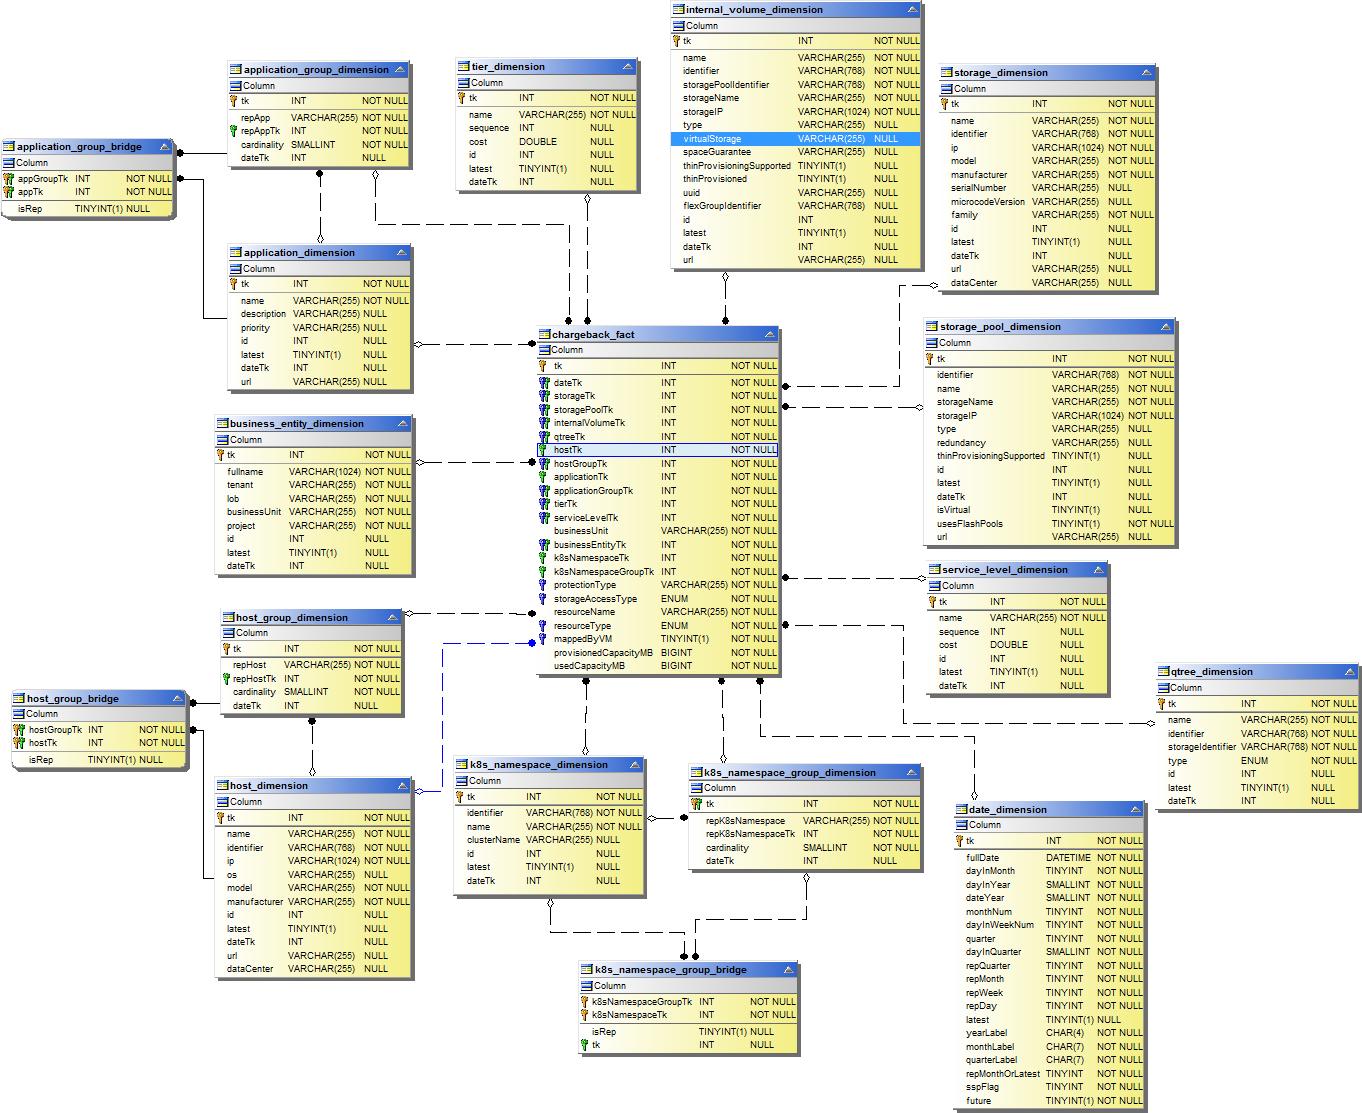
Chargeback
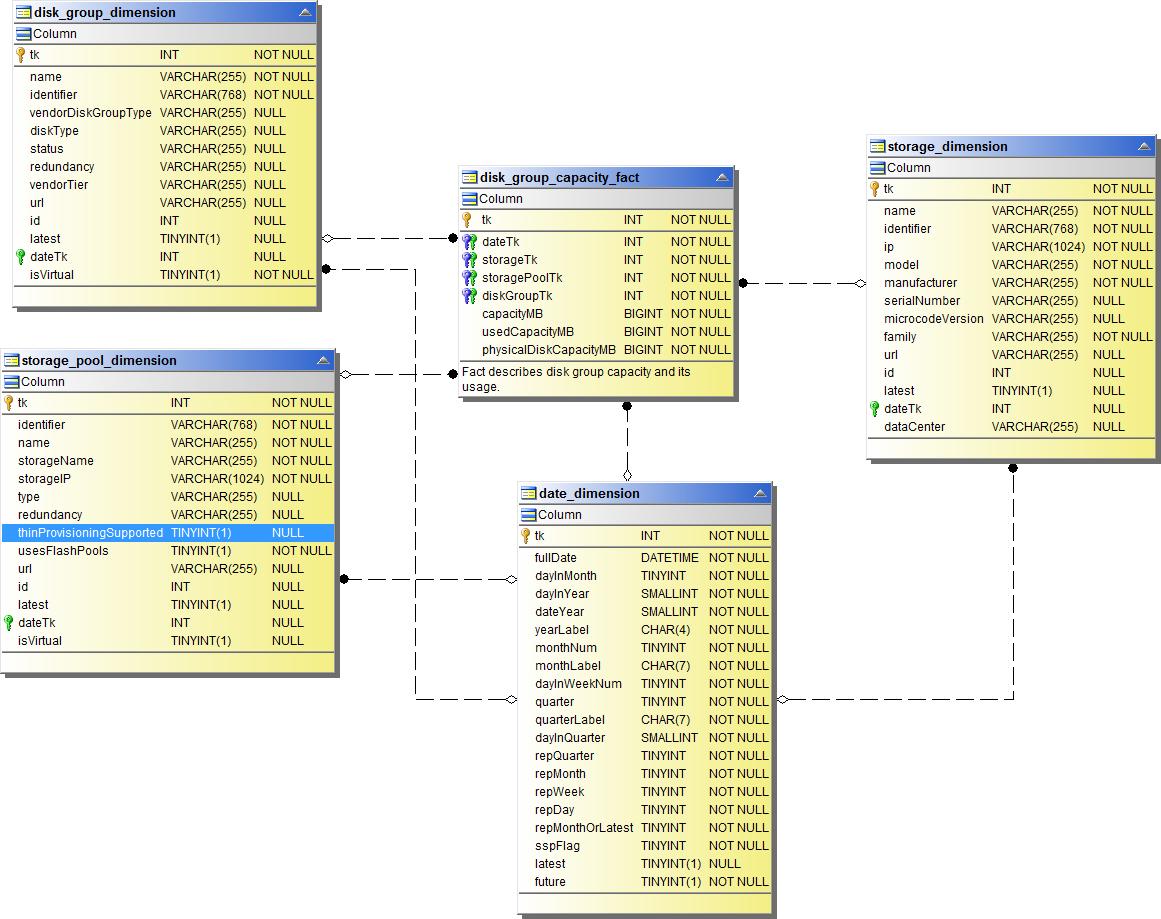
Disk Group Capacity
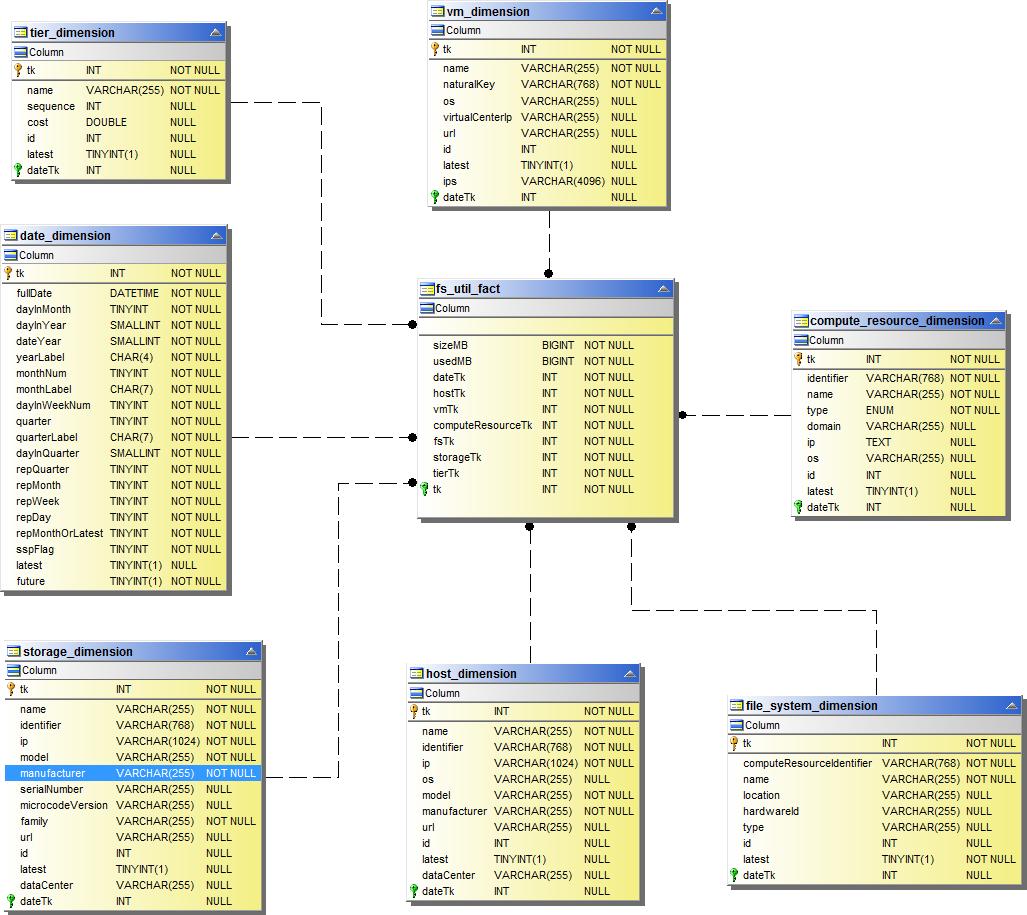
File System Utilization
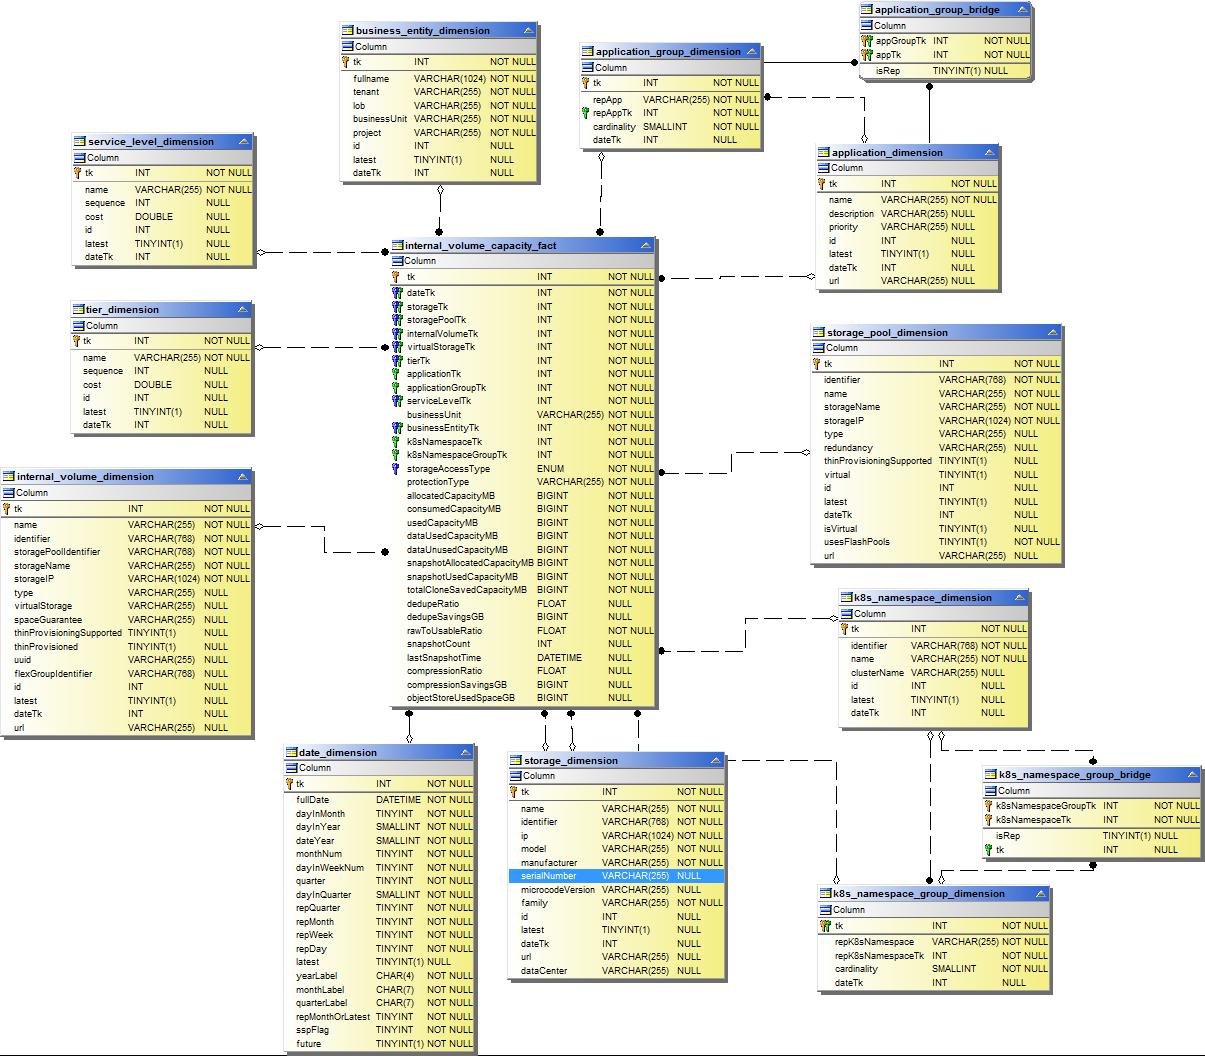
Internal Volume Capacity
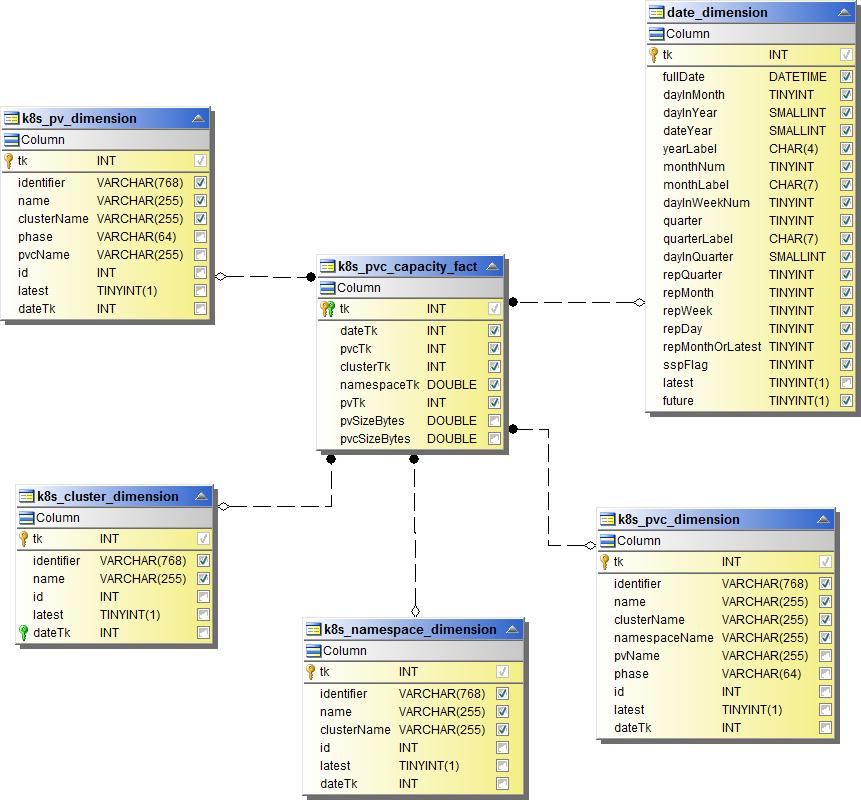
Kubernetes PV Capacity
Port Capacity
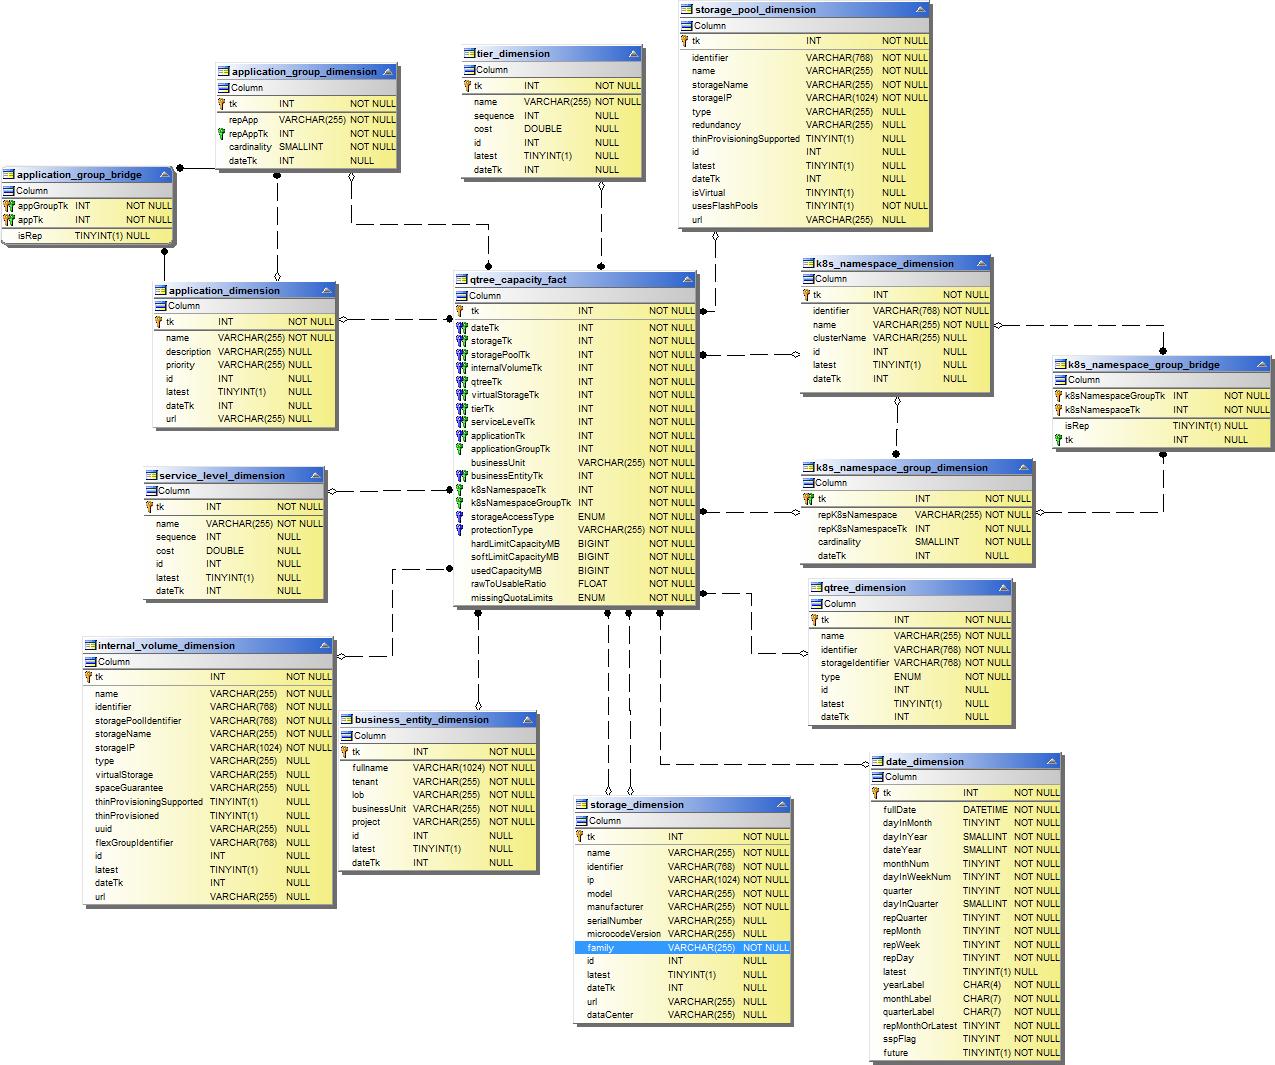
Qtree Capacity
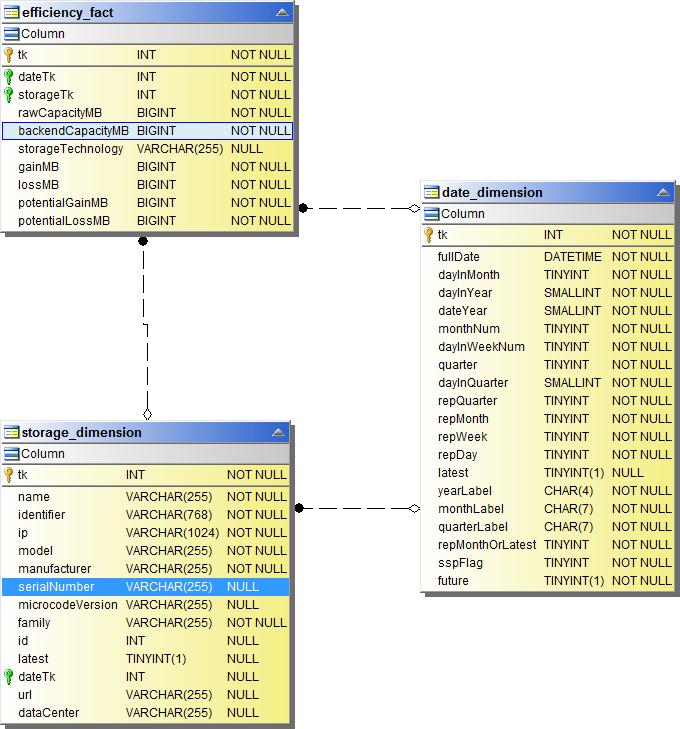
Storage Capacity Efficiency
Storage and Storage Pool Capacity

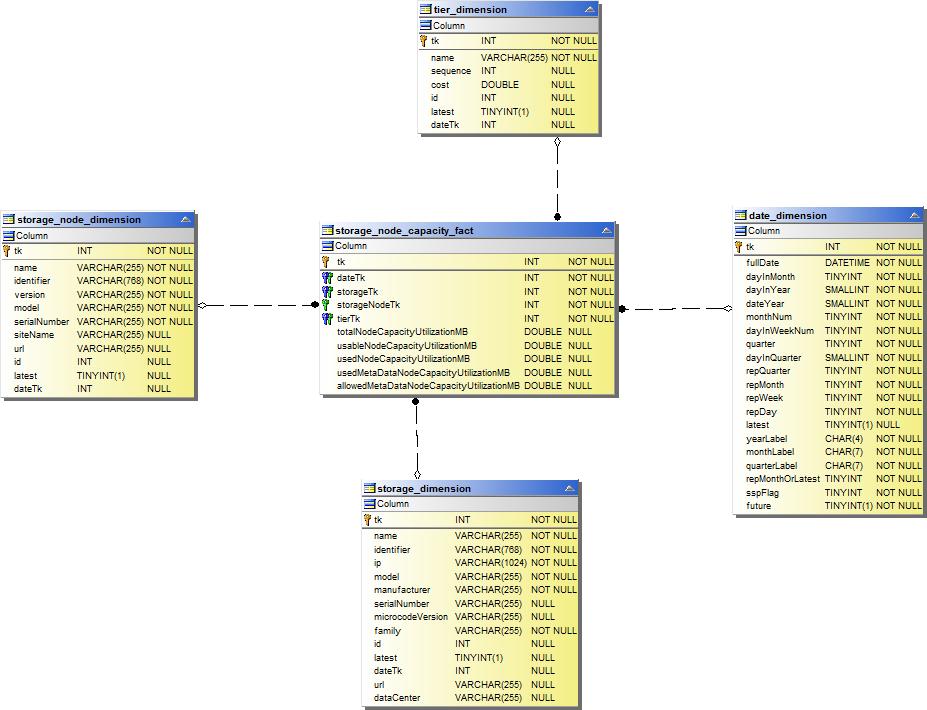
Storage Node Capacity
VM Capacity
Volume Capacity
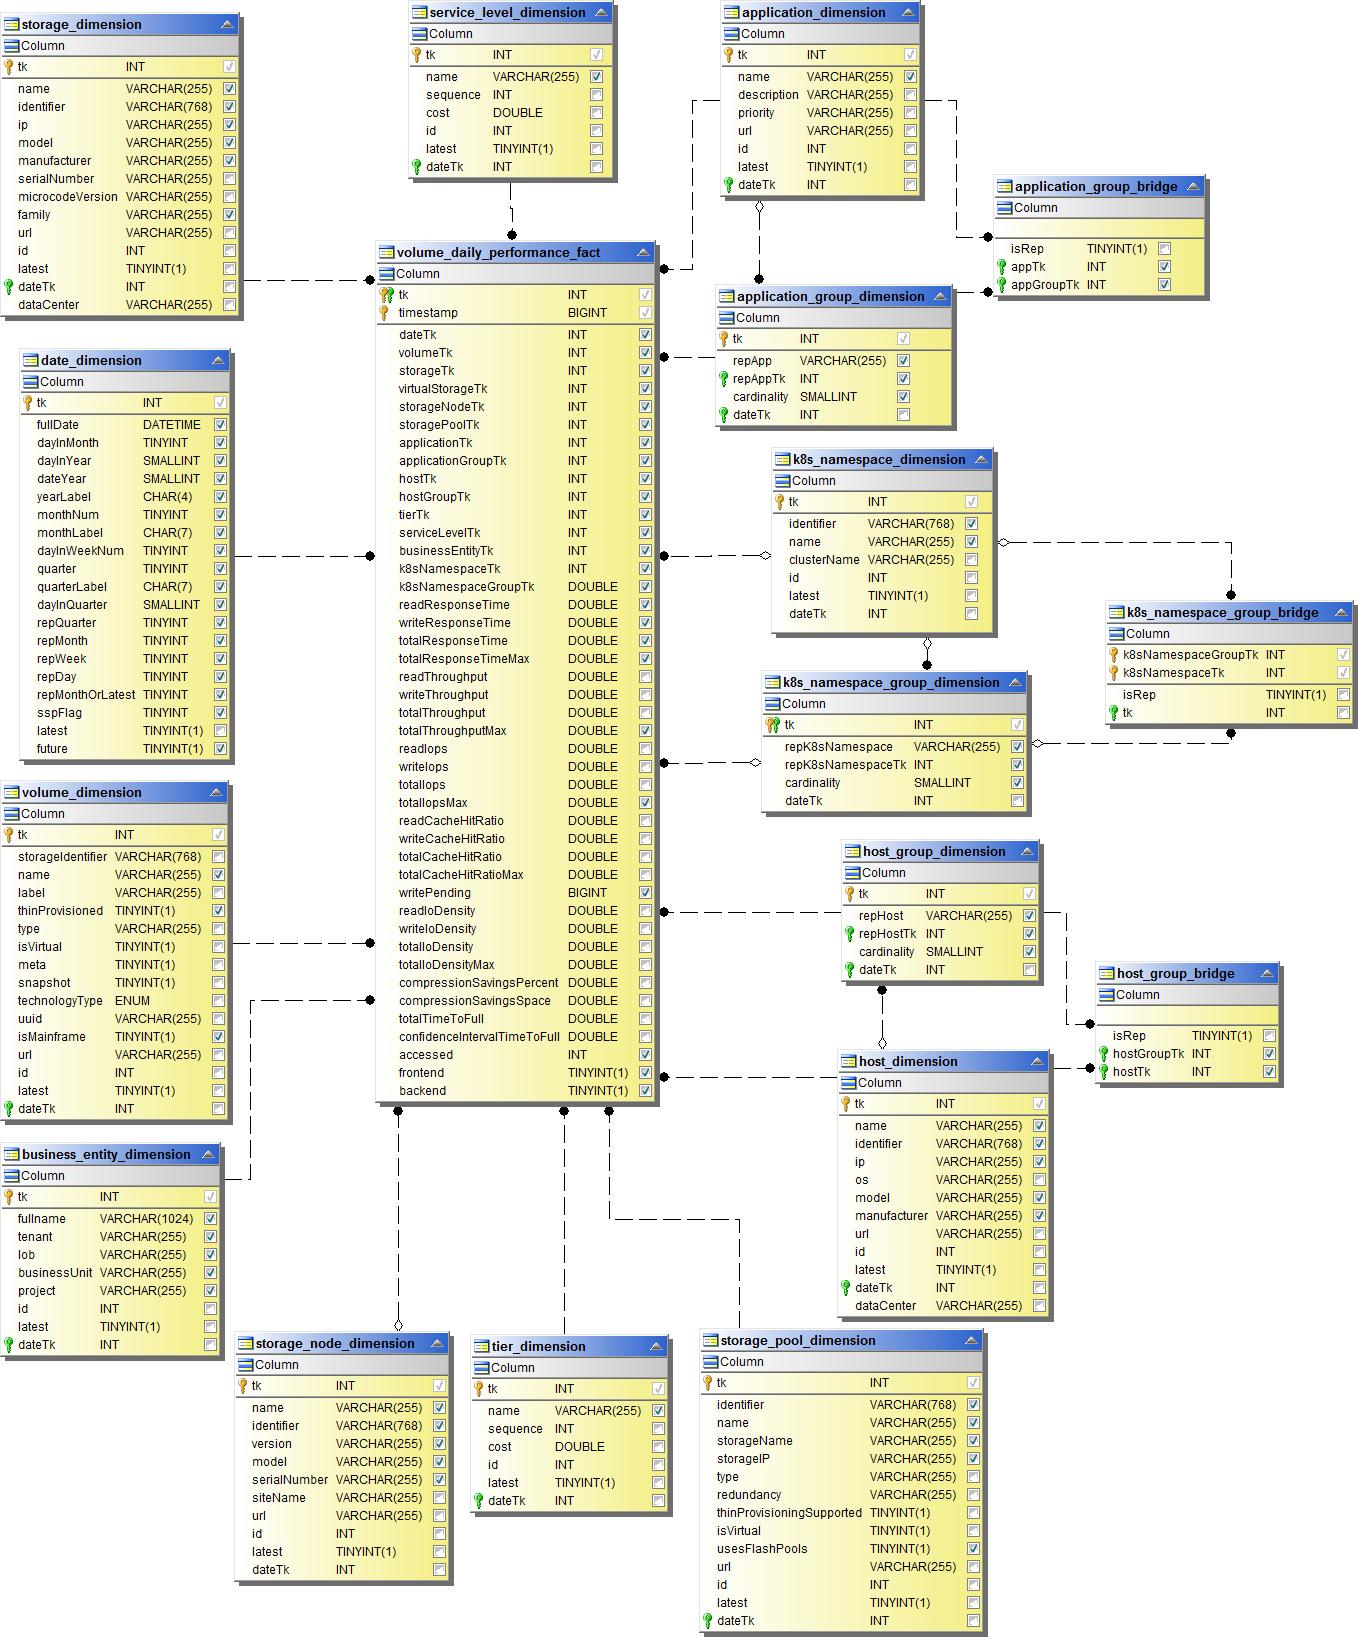
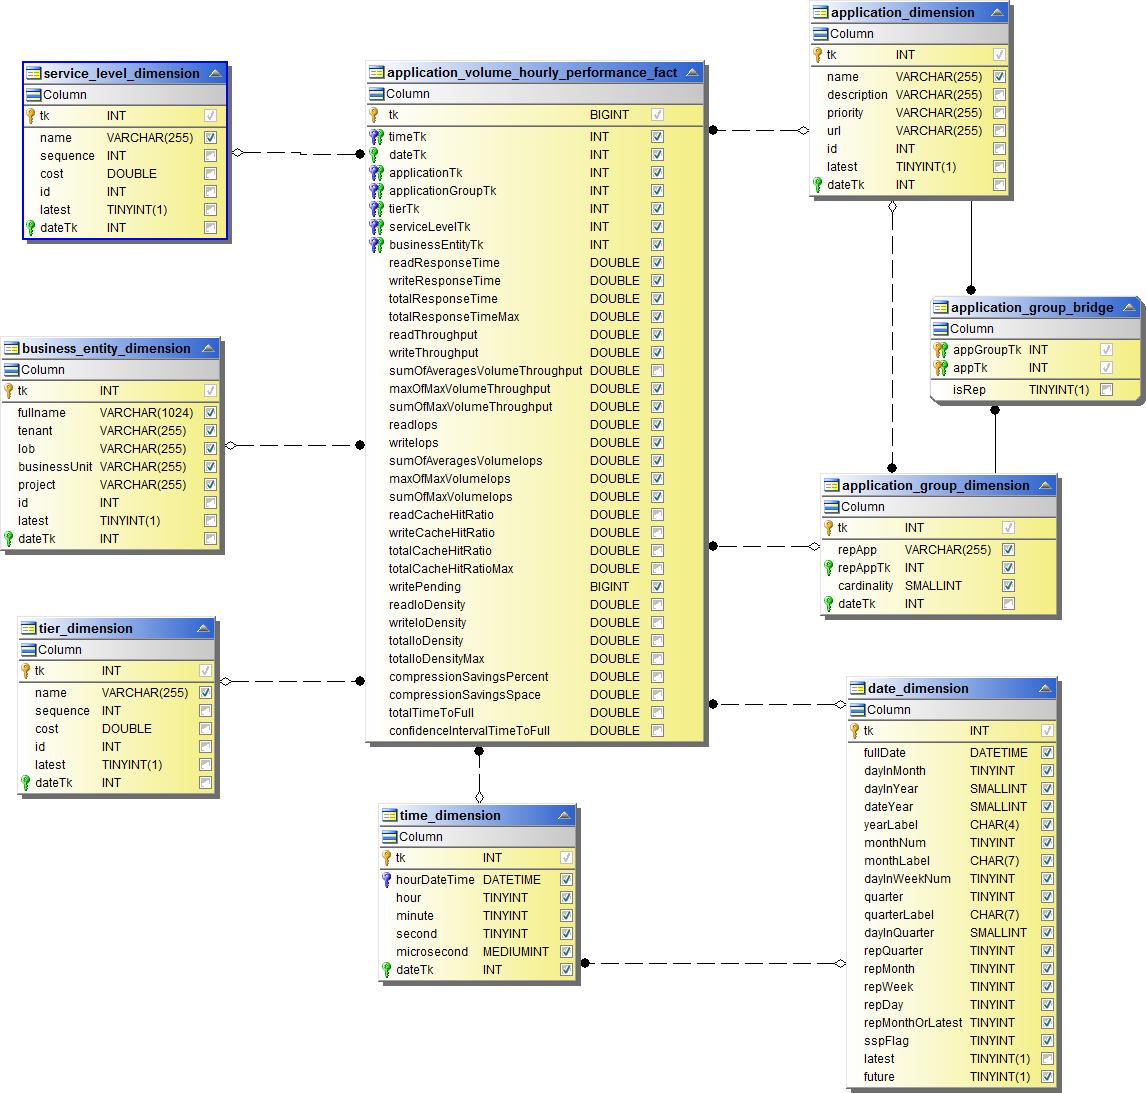
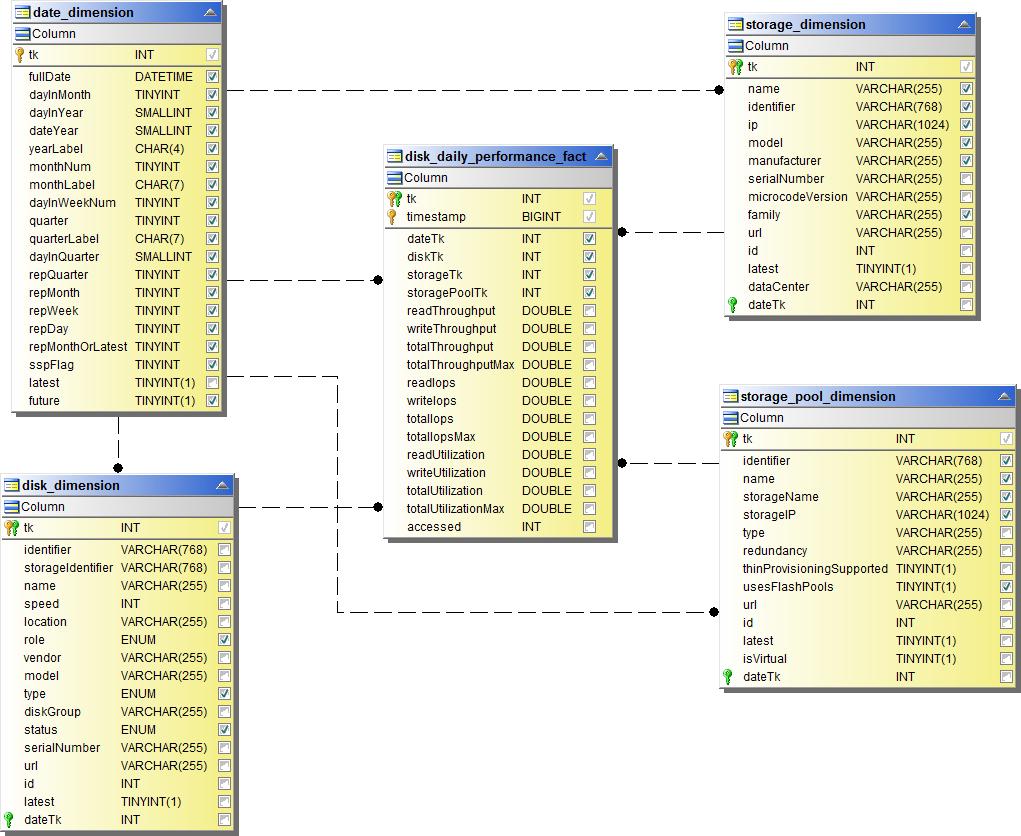
Performance Datamart
The following images describe the performance datamart.
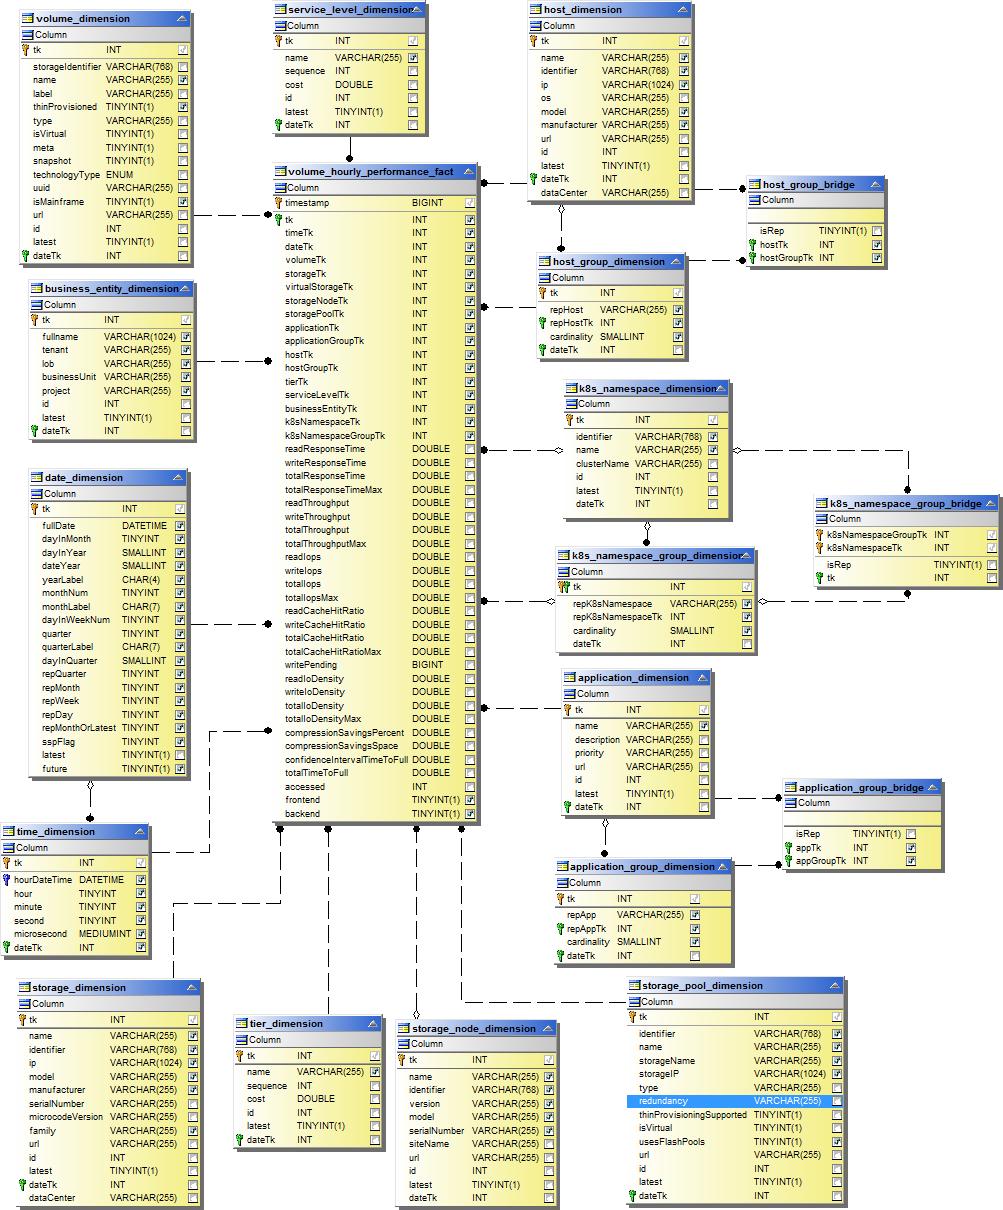
Application Volume Hourly Performance
Cluster Switch Performance

Disk Daily Performance
Disk Hourly Performance

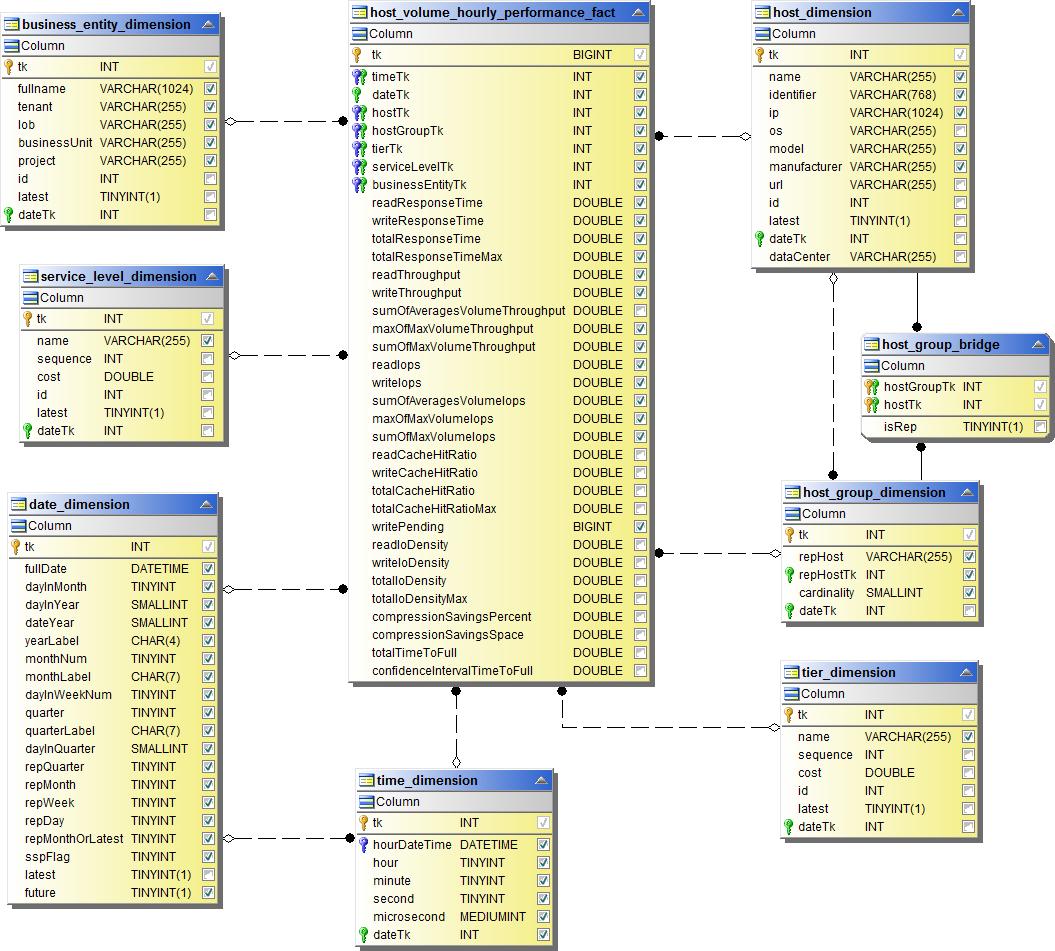
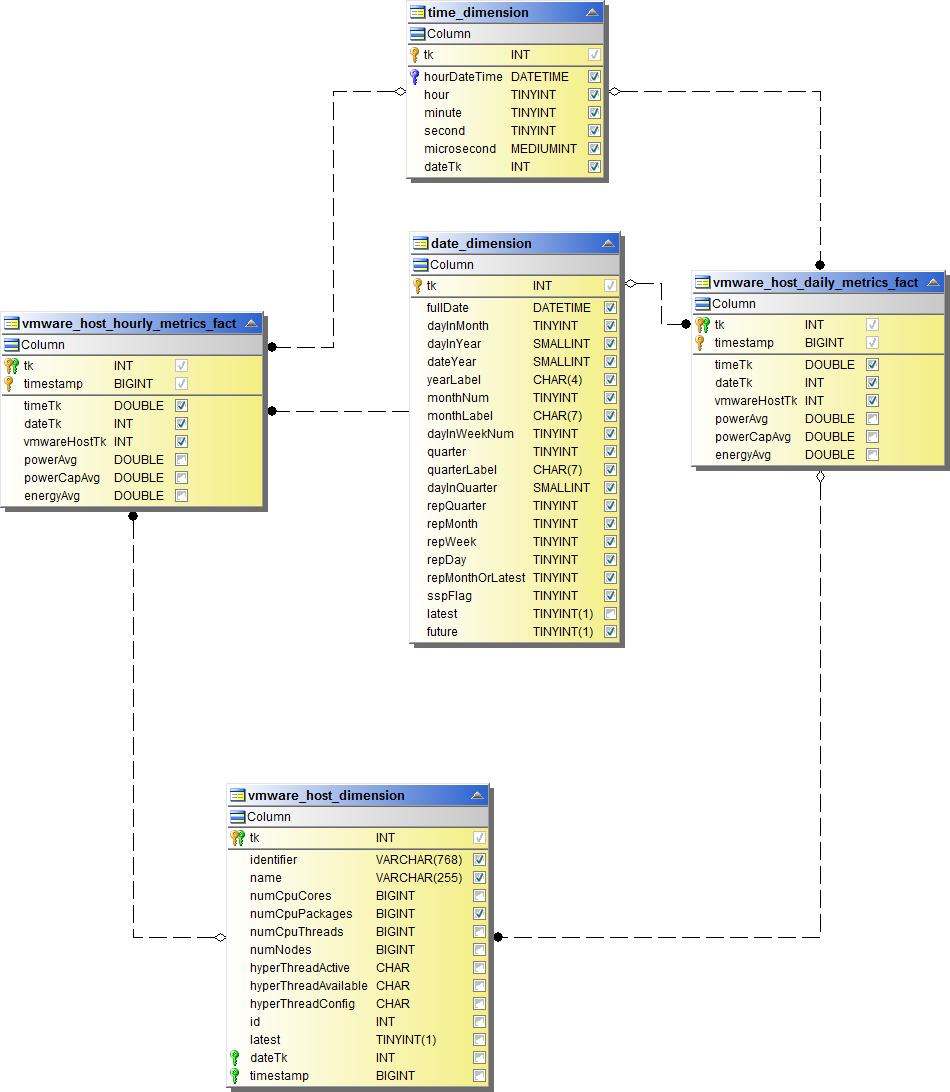
Host Hourly Performance
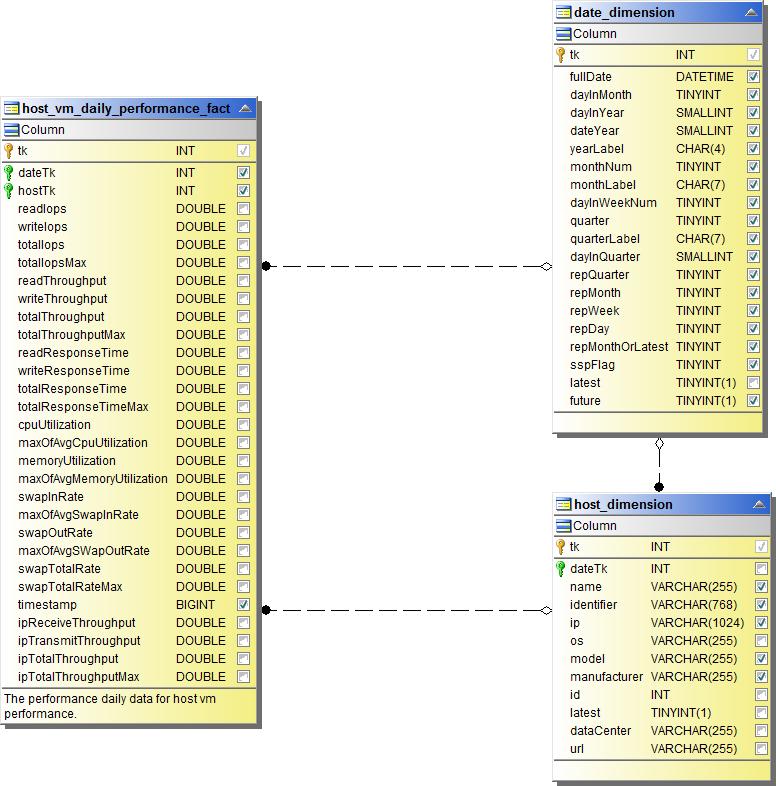
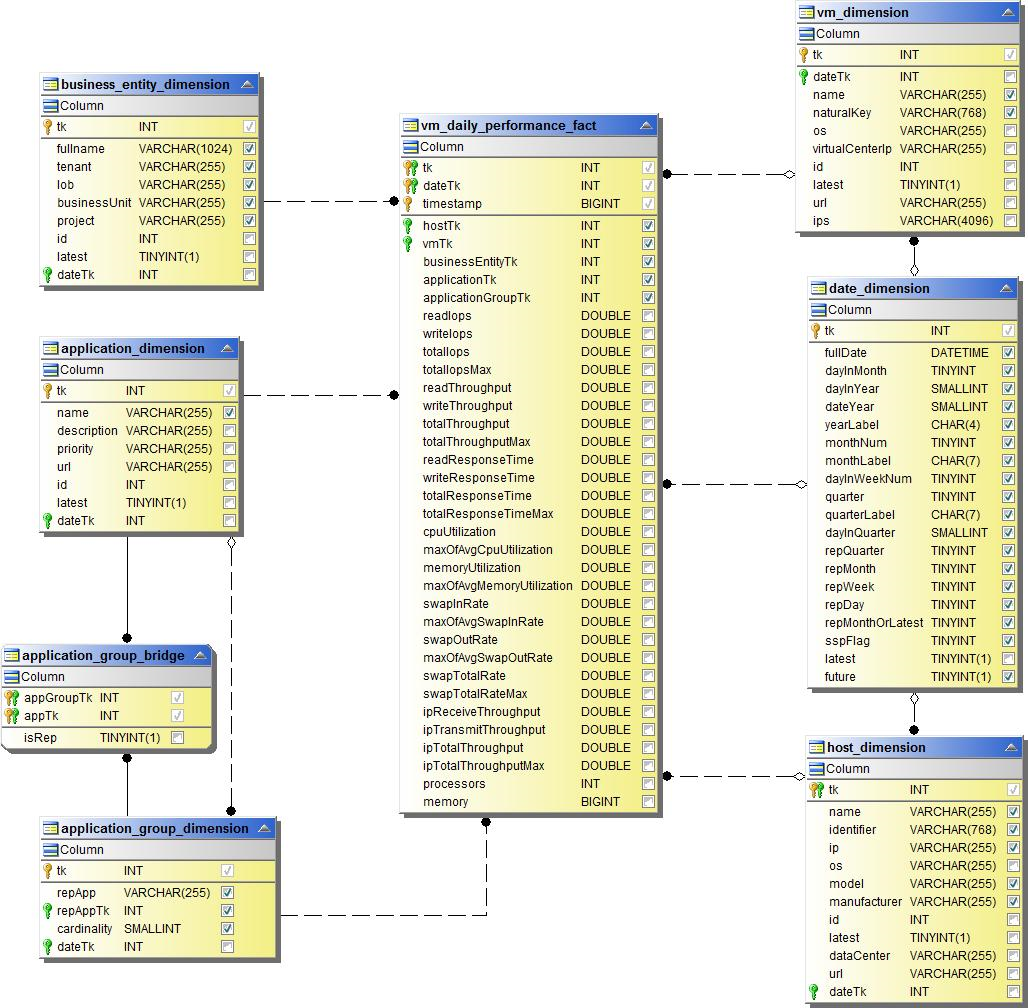
Host VM Daily Performance
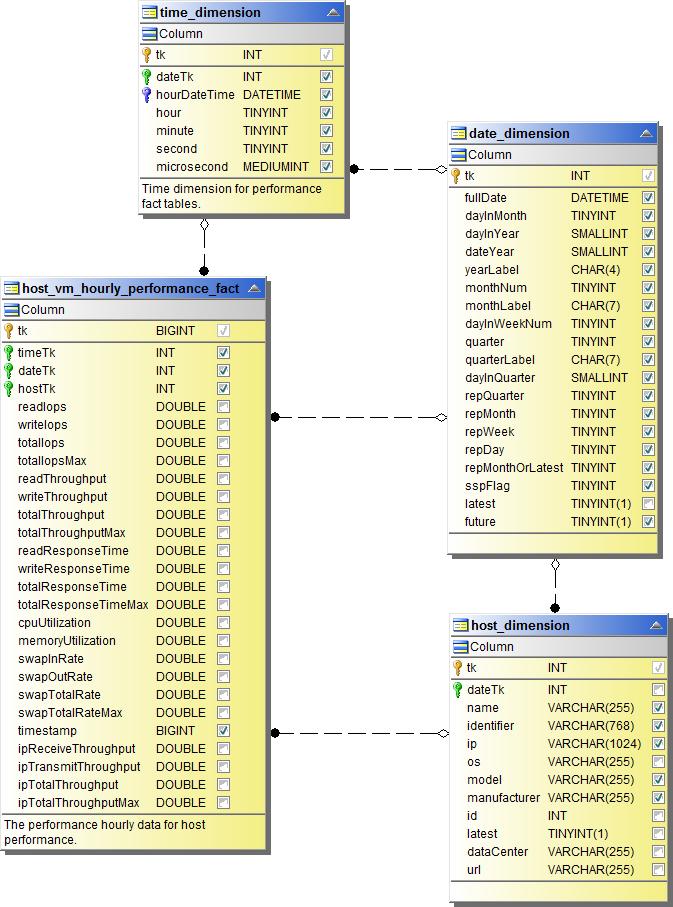
Host VM Hourly Performance
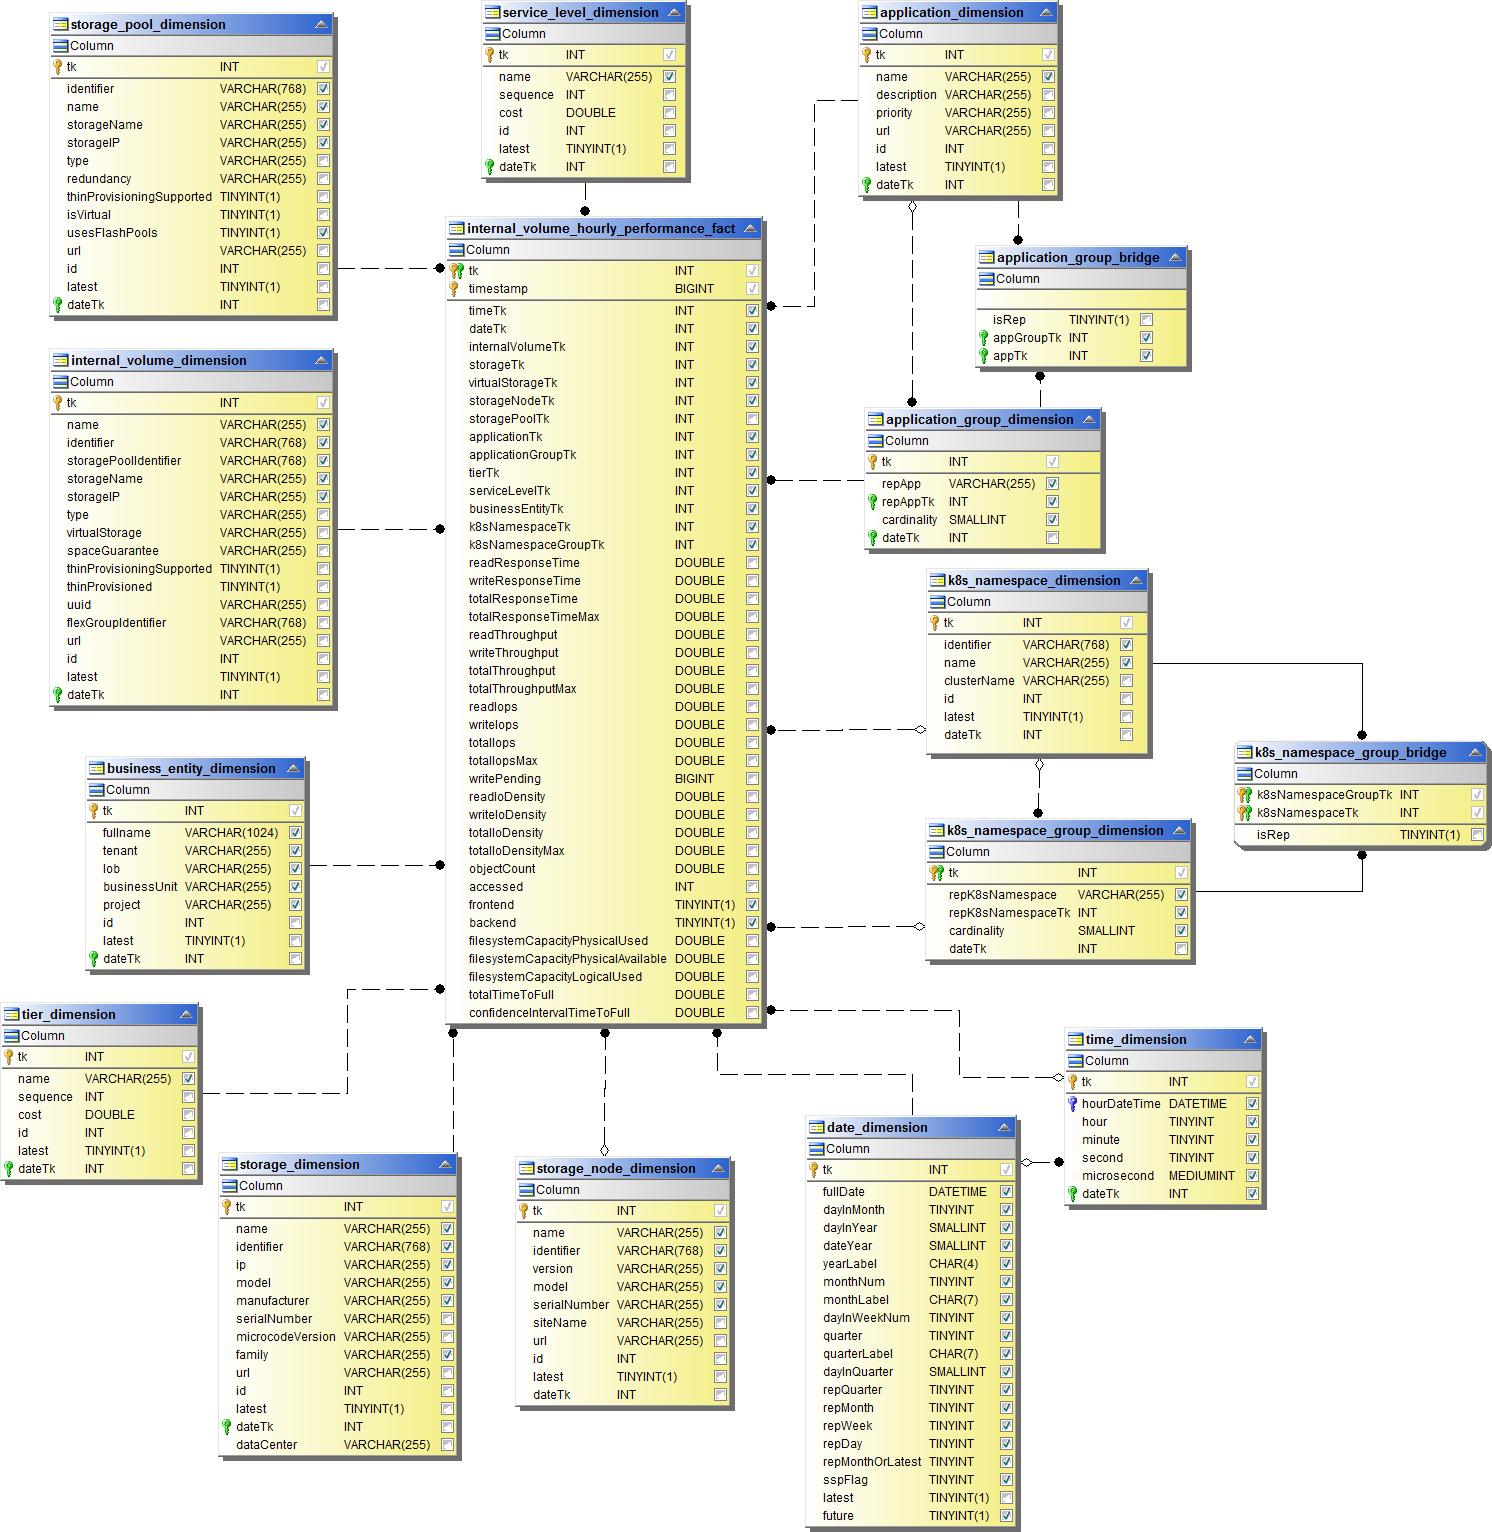
Internal Volume Hourly Performance
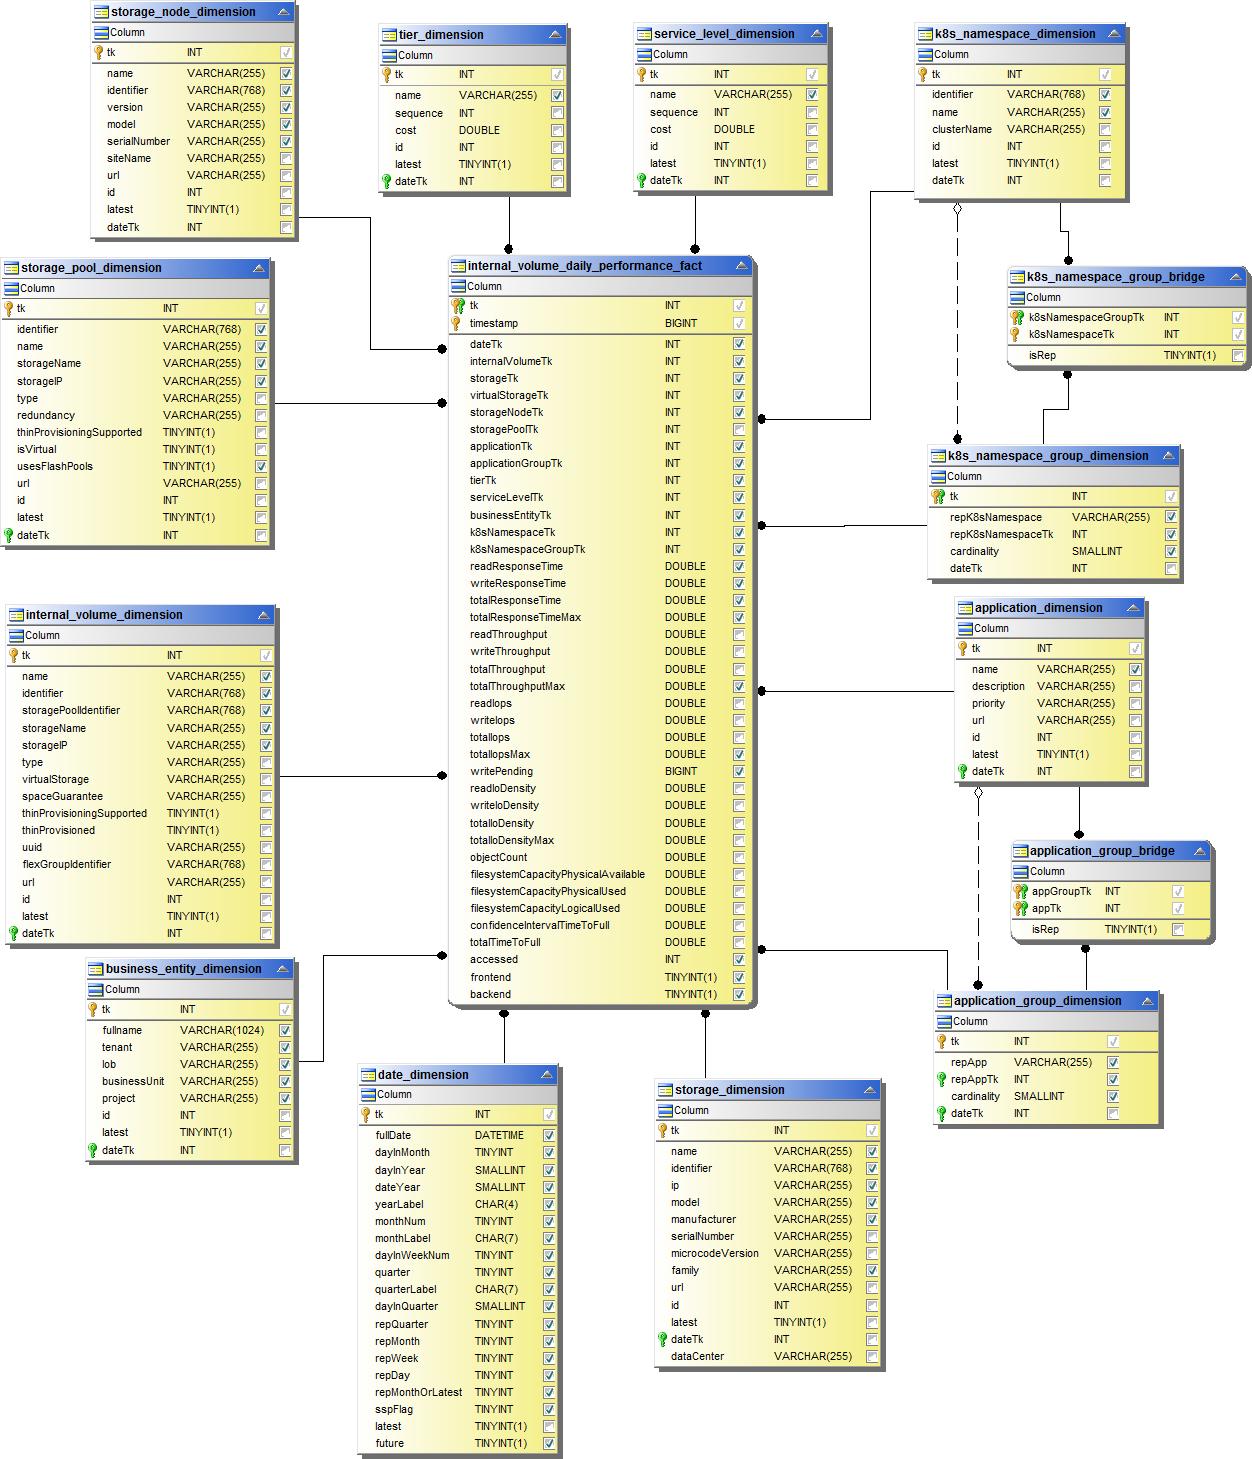
Internal Volume Daily Performance
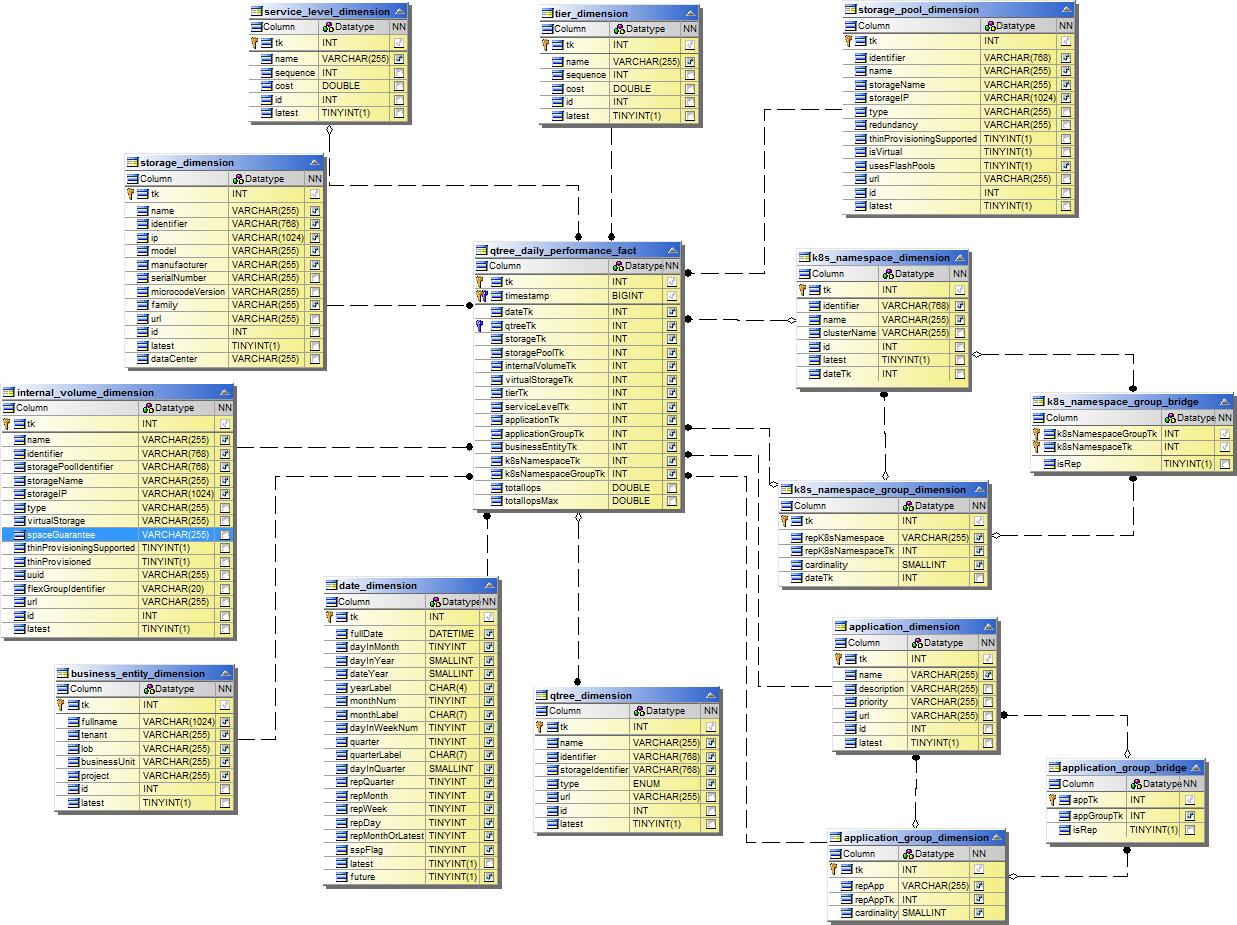
Qtree Daily Performance
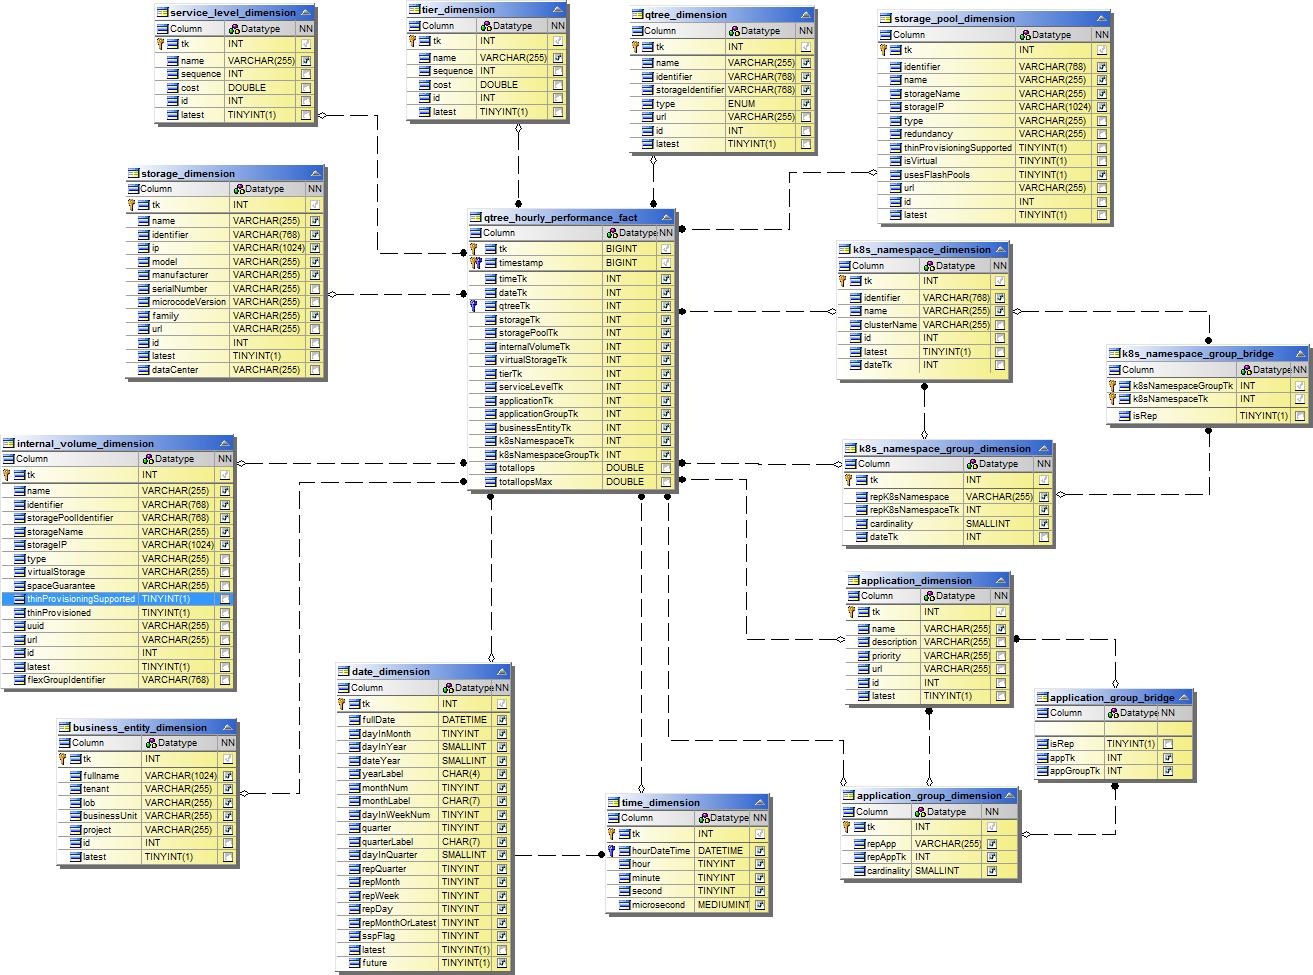
Qtree Hourly perfromance
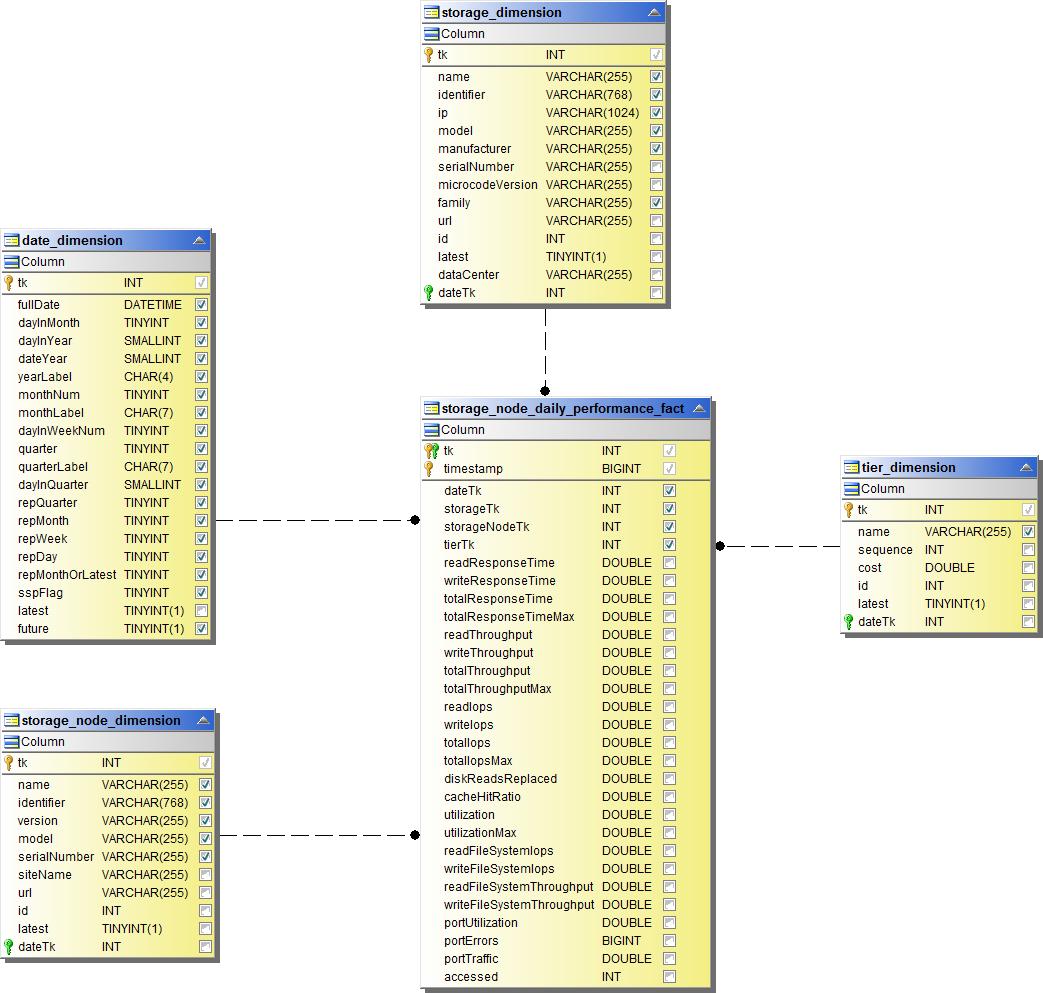
Storage Node Daily Performance
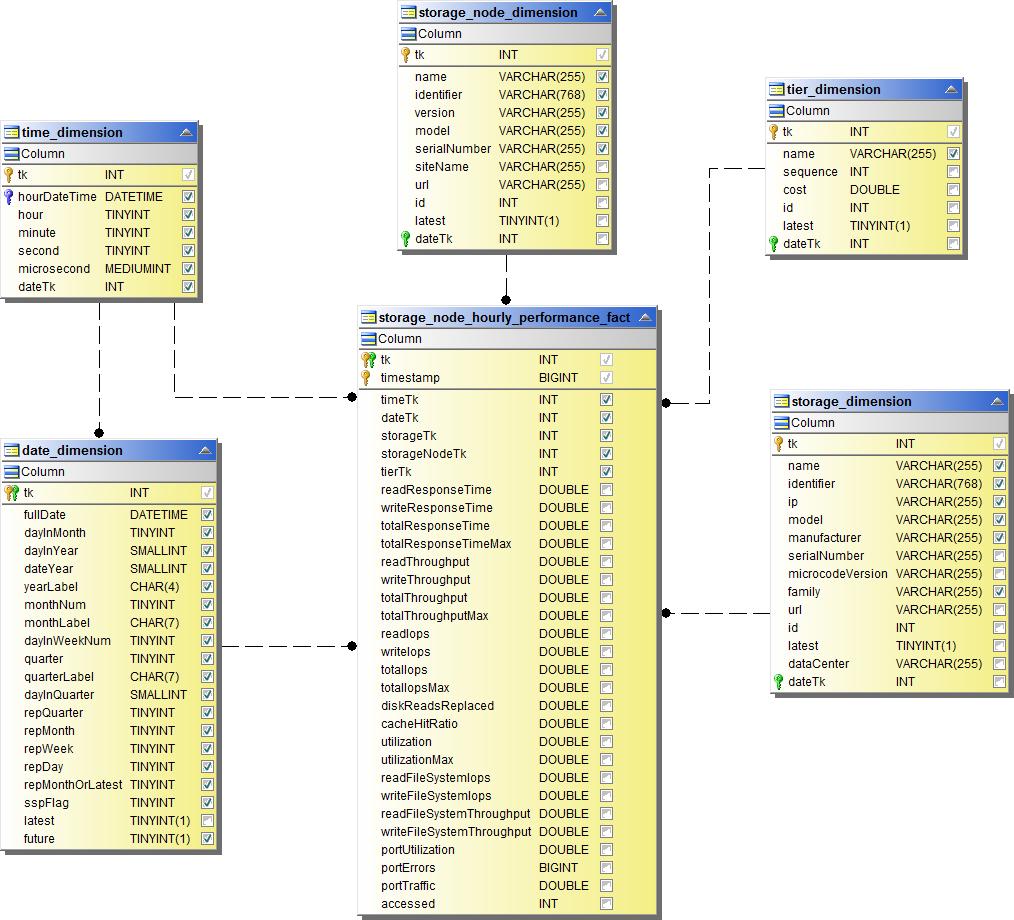
Storage Node Hourly Performance
Switch Hourly Performance for Host

Switch Hourly Performance for Port

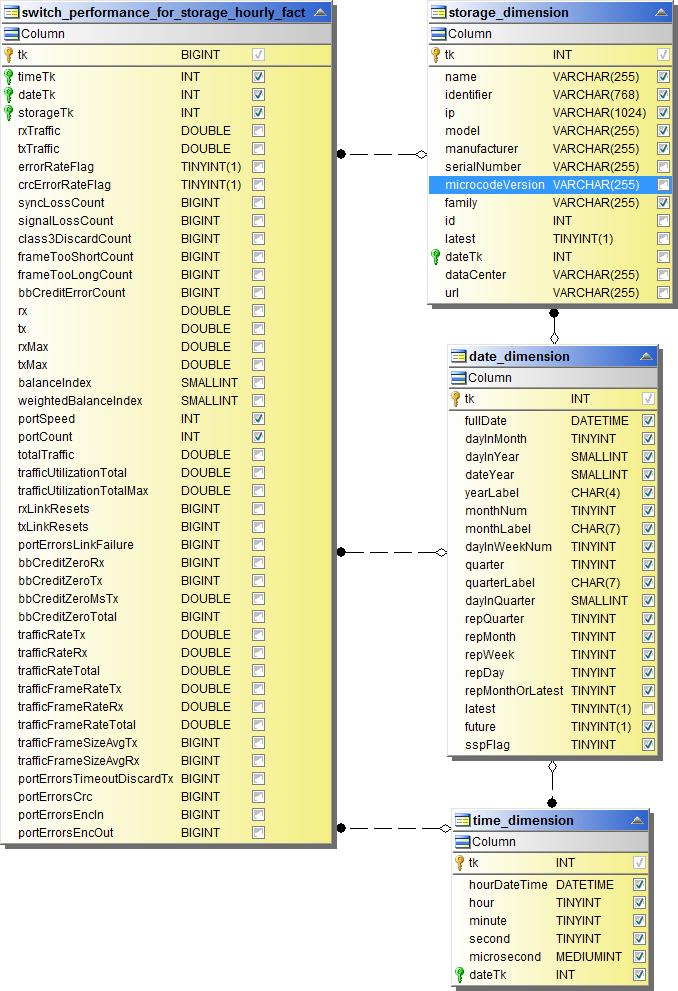
Switch Hourly Performance for Storage
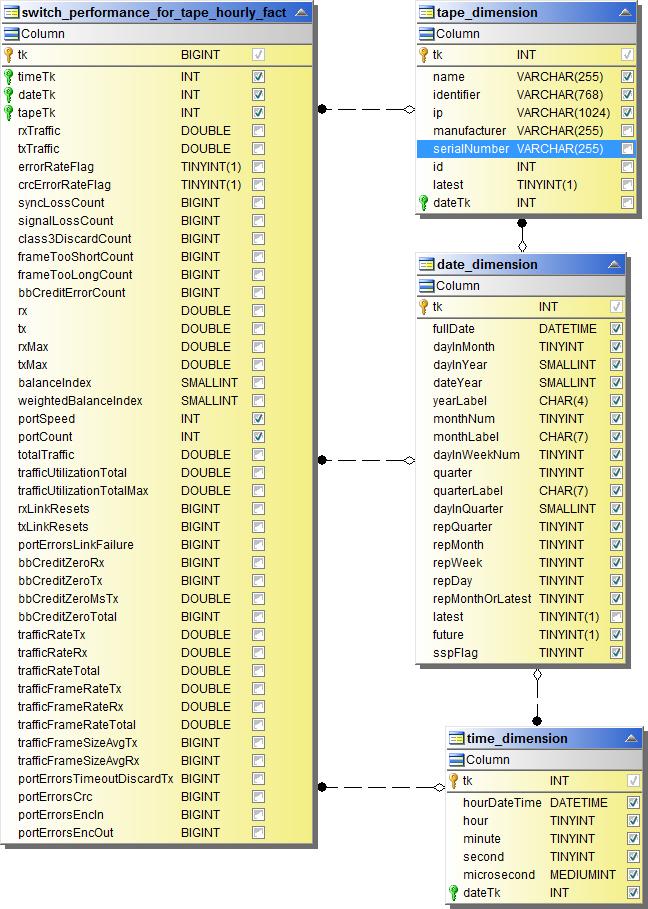
Switch Hourly Performance for Tape
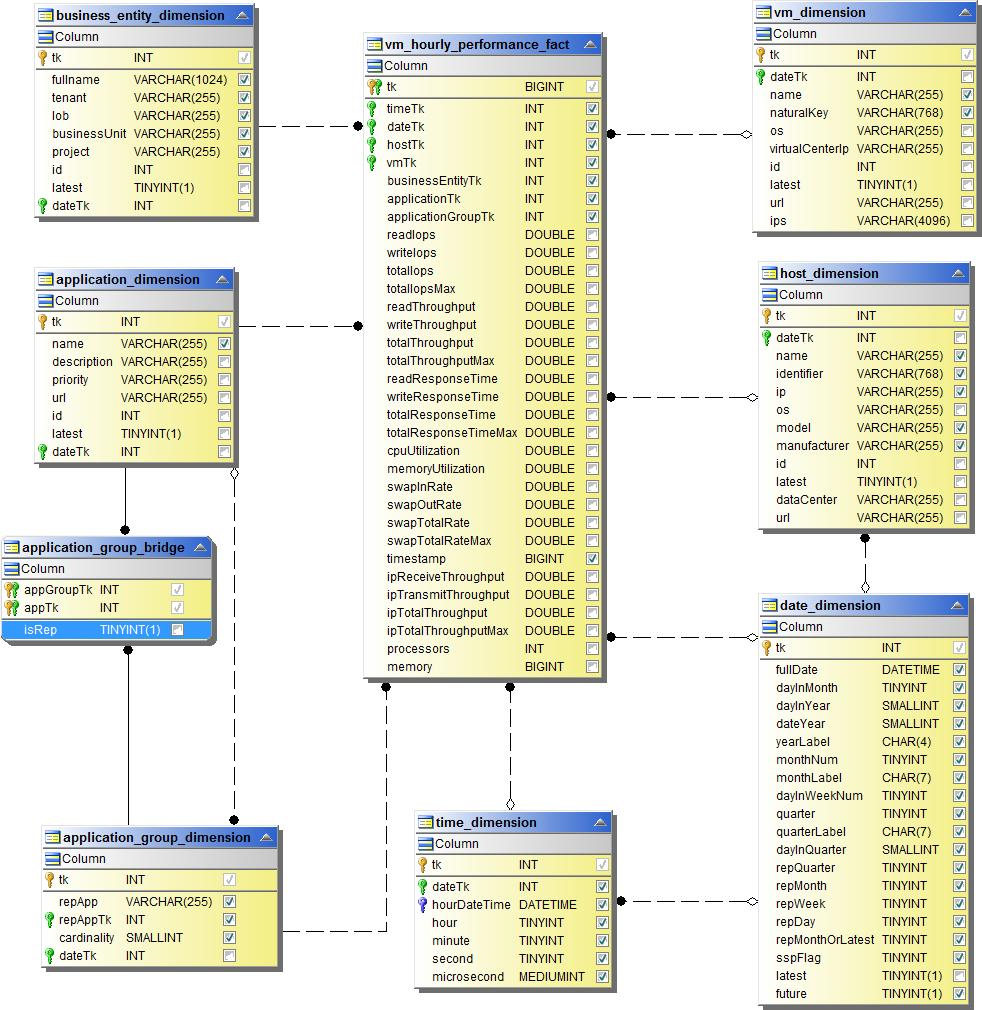
VM Performance
VM Daily Performance for Host
VM Hourly Performance for Host
VM Daily Performance for Host
VM Hourly Performance for Host
VMDK Daily Performance

VMDK Hourly Performance

Volume Hourly Performance
Volume Daily Performance