

Use cases
 Suggest changes
With Cloud Insights set up and configured to monitor your FlexPod Datacenter solution, we can explore some of the tasks that you can perform on the dashboard to assess and monitor your environment. In this section, we highlight five primary use cases for Cloud Insights:
-
Digital Advisor integration
-
Exploring real-time dashboards
-
Creating custom dashboards
-
Advanced troubleshooting
-
Storage optimization
Digital Advisor integration
Cloud Insights is fully integrated into the Digital Advisor storage monitoring platform. An ONTAP system, deployed as a part of a FlexPod Datacenter solution, is automatically configured to send information back to NetApp through the AutoSupport function, which is built into each system. These reports are generated on a scheduled basis, or dynamically whenever a fault is detected in the system. The data communicated through AutoSupport is aggregated and displayed in easily accessible dashboards under the Digital Advisor menu in Cloud Insights.
Access Digital Advisor information through the Cloud Insights dashboard
To access the Digital Advisor information through the Cloud Insights dashboard, complete the following steps:
-
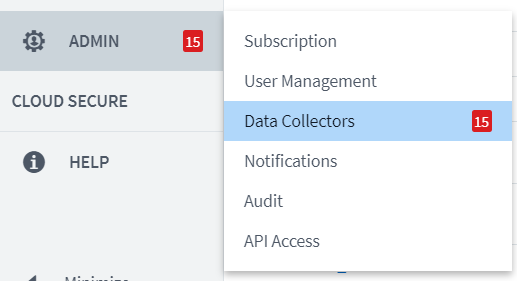
Click the Data Collector option under the Admin menu on the left.
-
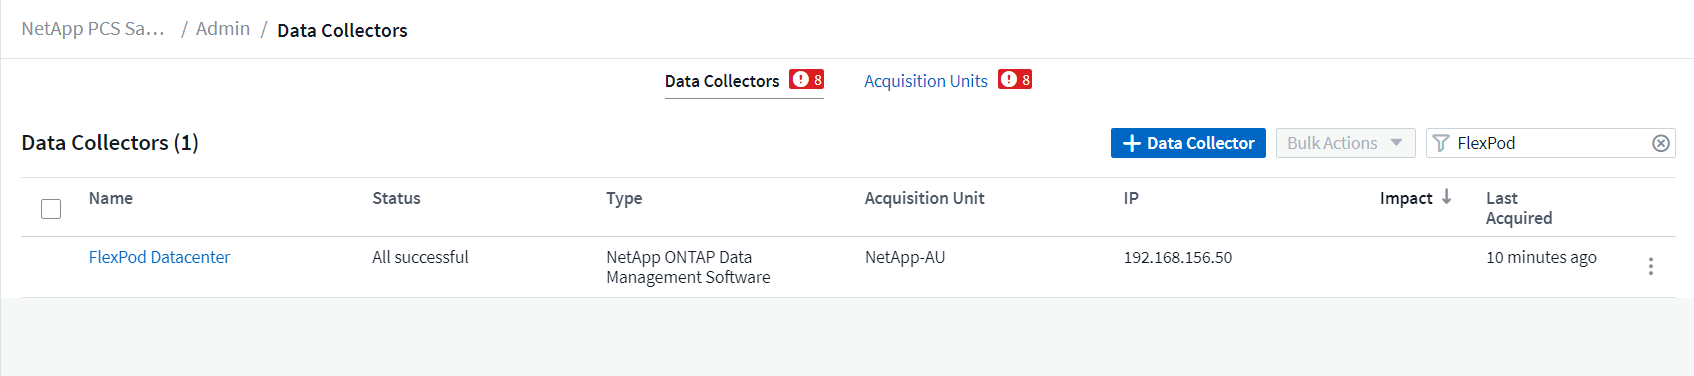
Filter for the specific Data Collector in your environment. In this example, we filter by the term FlexPod.
-
Click the Data Collector to get a summary of the environment and devices that are being monitored by that collector.
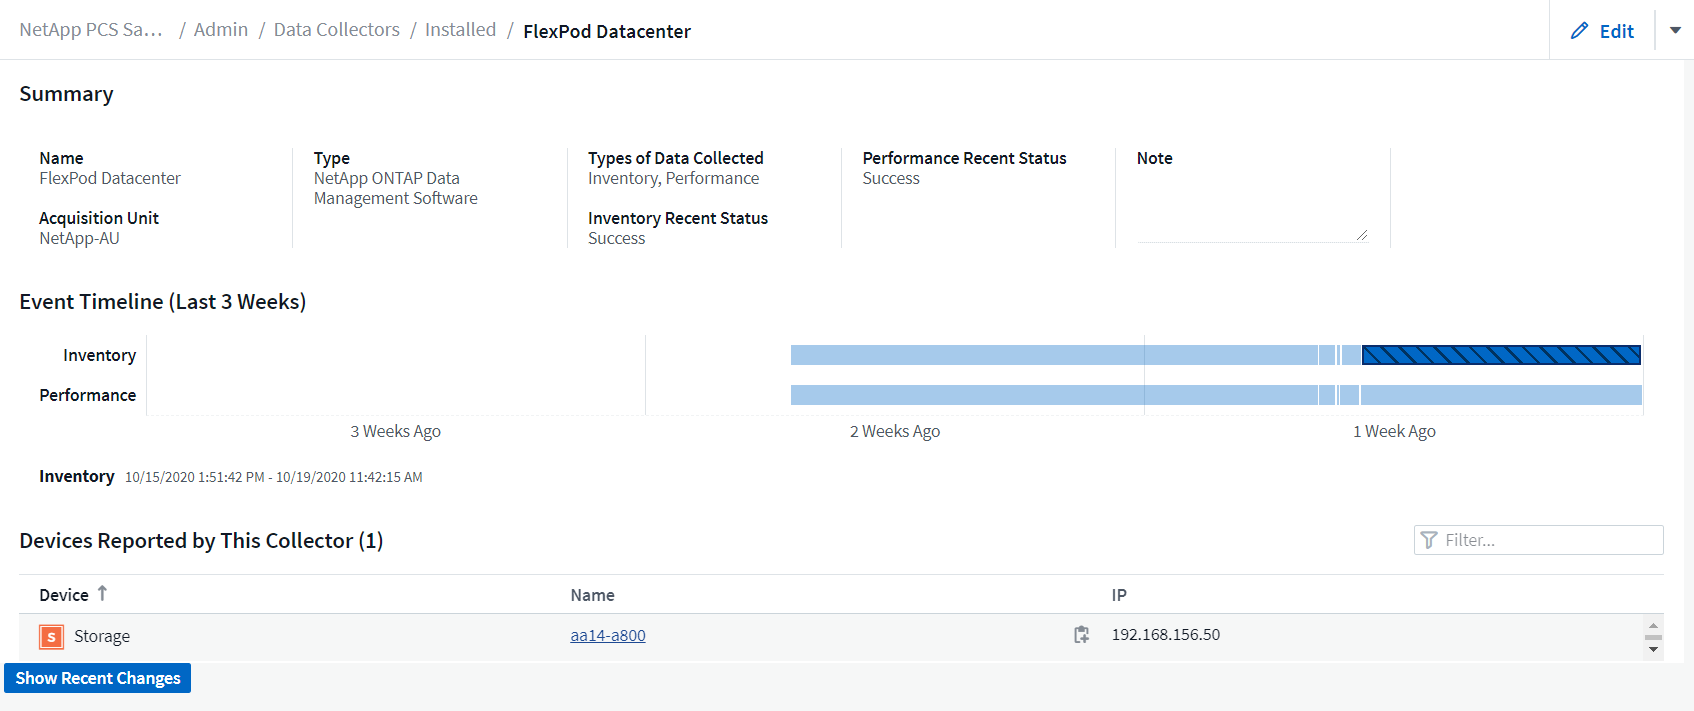
Under the device list near the bottom, click on the name of the ONTAP storage system being monitored. This displays a dashboard of information collected about the system, including the following details:
-
Model
-
Family
-
ONTAP Version
-
Raw Capacity
-
Average IOPS
-
Average Latency
-
Average Throughput
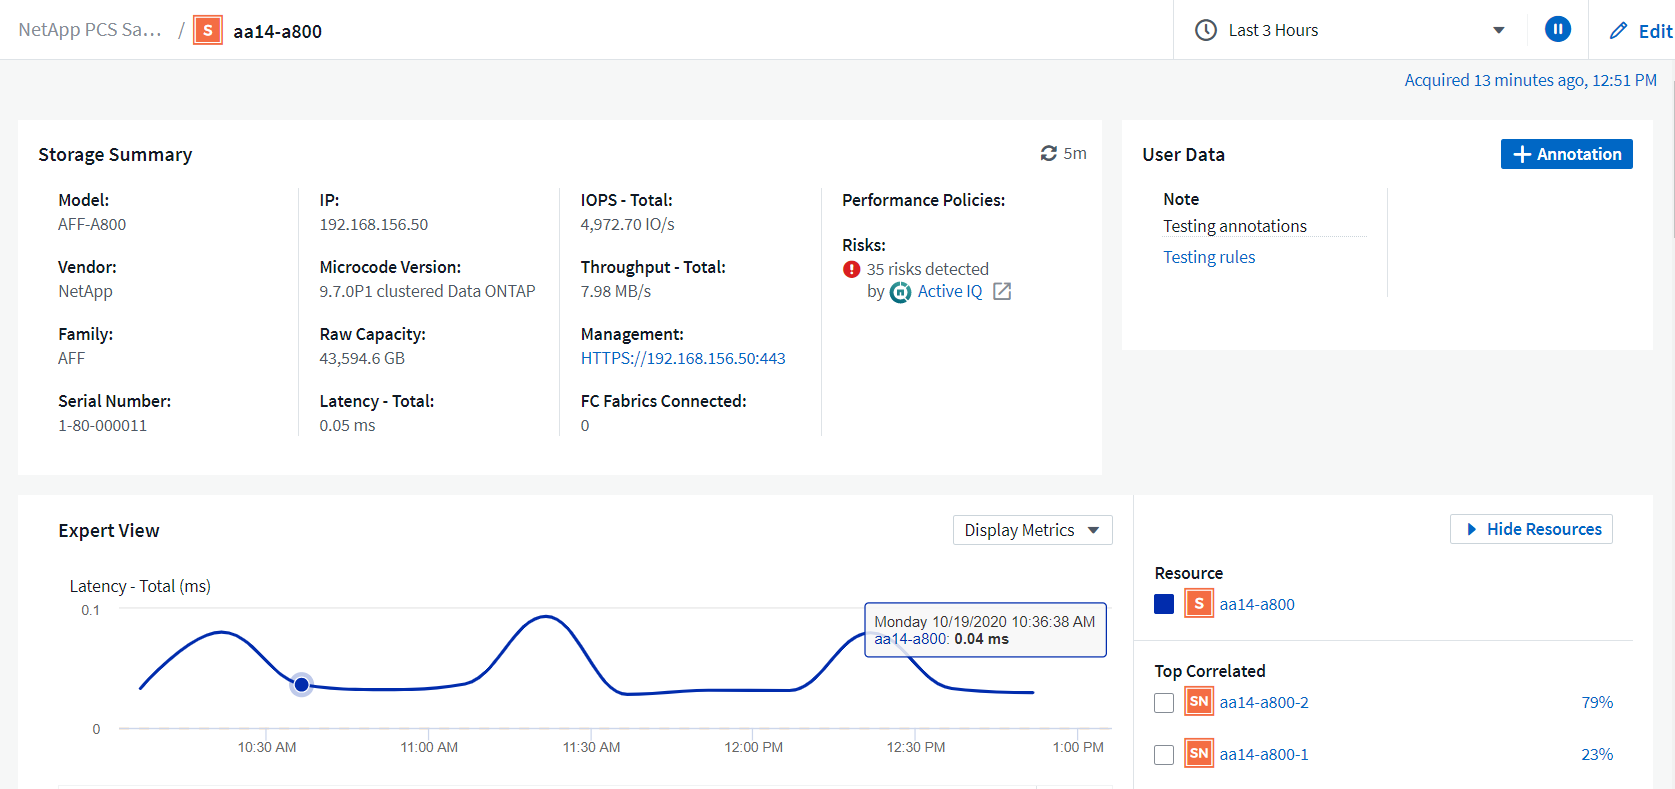
Also, on this page under the Performance Policies section, you can find a link to NetApp Digital Advisor.
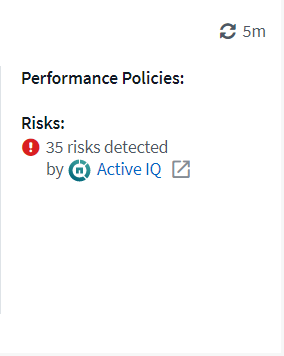
-
-
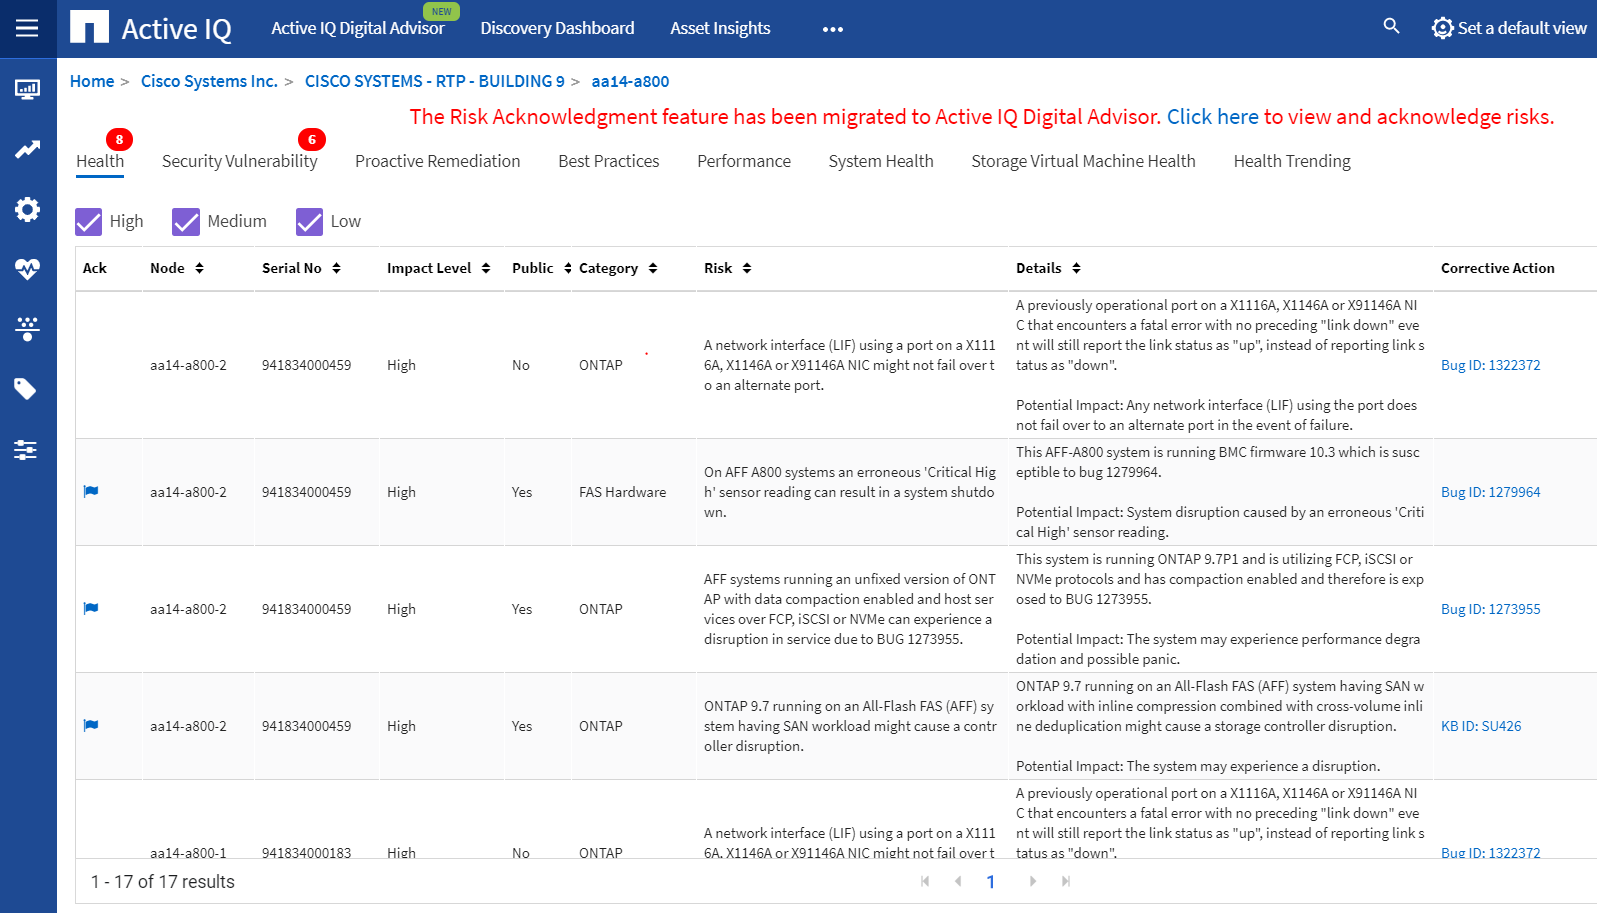
To open a new browser tab and take you to the risk mitigation page, which shows which nodes are affected, how critical the risks are, and what the appropriate action is that needs to be taken to correct the identified issues, click the link for Digital Advisor.
Explore real-time dashboards
Cloud Insights can display real-time dashboards of the information that has been polled from the ONTAP storage system deployed in a FlexPod Datacenter solution. The Cloud Insights Acquisition Unit collects data in regular intervals and populates the default storage system dashboard with the information collected.
Access real-time graphs through the Cloud Insights dashboard
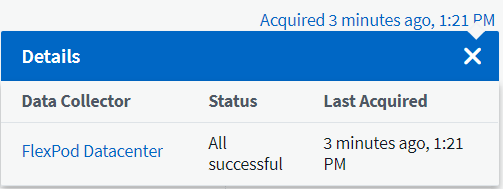
From the storage system dashboard, you can see the last time that the Data Collector updated the information. An example of this is shown in the figure below.
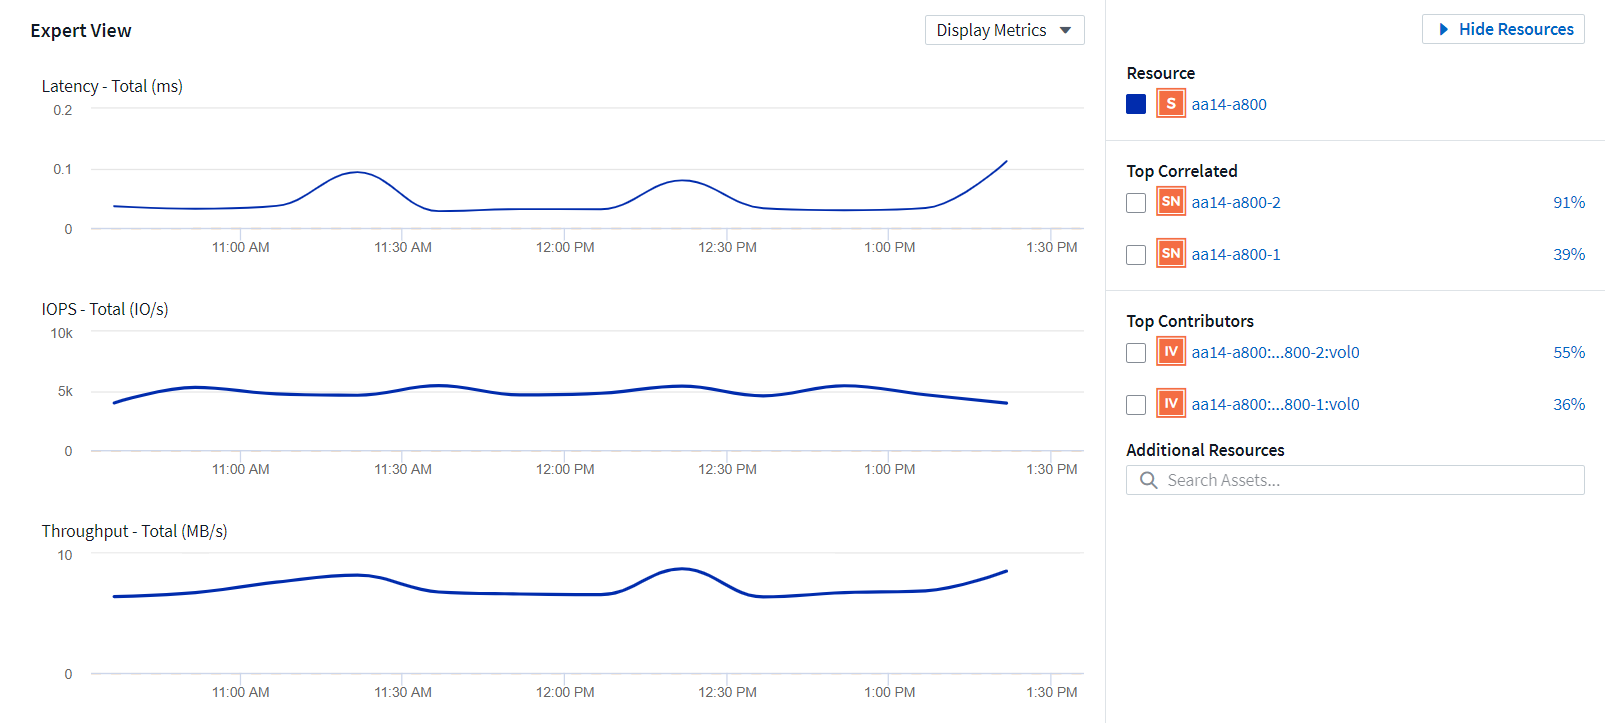
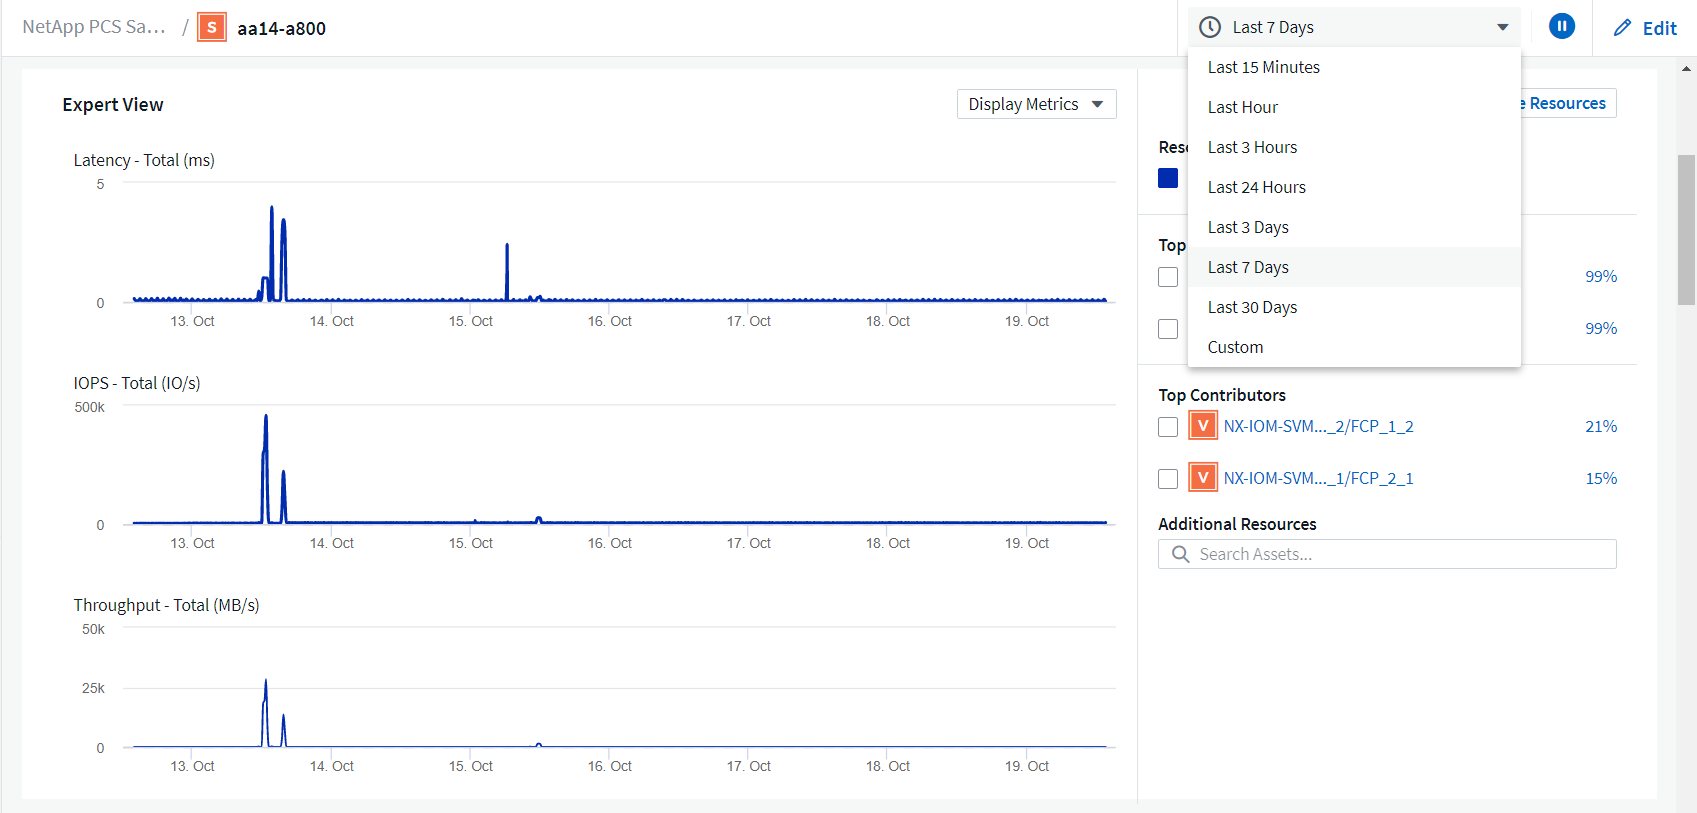
By default, the storage system dashboard displays several interactive graphs that show system-wide metrics from the storage system being polled, or from each individual node, including: Latency, IOPS, and Throughput, in the Expert View section. Examples of these default graphs are shown in the figure below.
By default, the graphs show information from the last three hours, but you can set this to a number of differing values or a custom value from the dropdown list near the top right of the storage system dashboard. This is shown in the figure below.
Create custom dashboards
In addition to making use of the default dashboards that display system-wide information, you can use Cloud Insights to create fully customized dashboards that enable you to focus on resource use for specific storage volumes in the FlexPod Datacenter solution, and thus the applications deployed in the converged infrastructure that depend on those volumes to run effectively. Doing so can help you to create a better visualization of specific applications and the resources they consume in the data center environment.
Create a customized dashboard to assess storage resources
To create a customized dashboard to assess storage resources, complete the following steps:
-
To create a customized dashboard, hover over Dashboards on the Cloud Insights main menu and click + New Dashboard in the dropdown list.
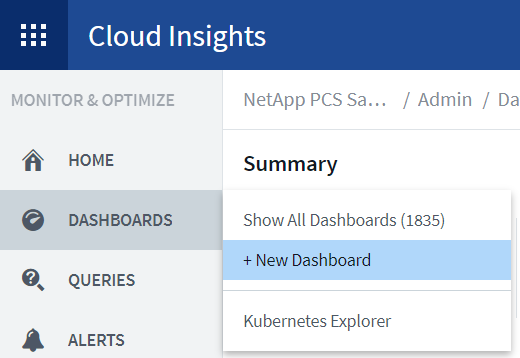
The New Dashboard window opens.
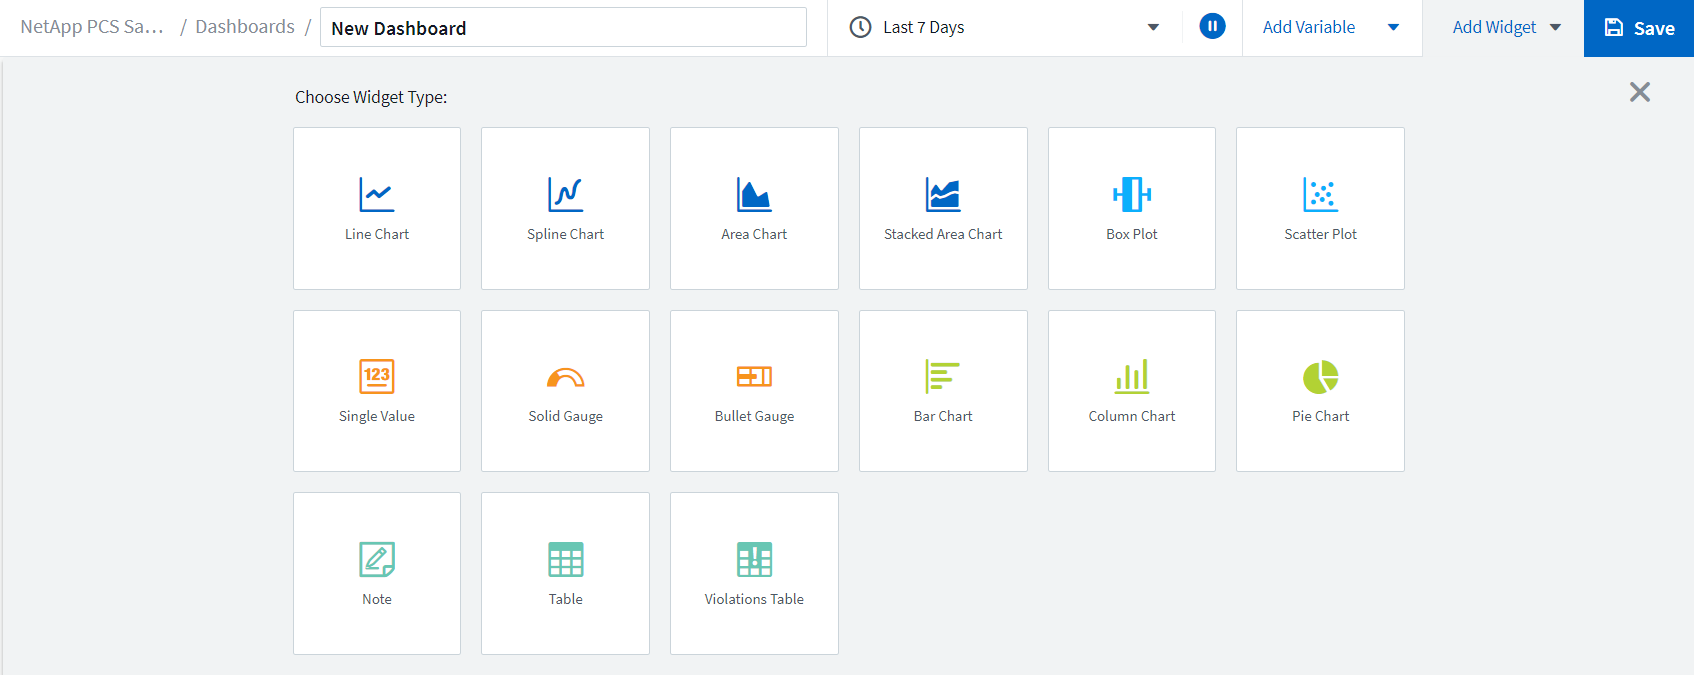
-
Name the dashboard and select the type of widget used to display the data. You can select from a number of graph types or even notes or table types to present the collected data.
-
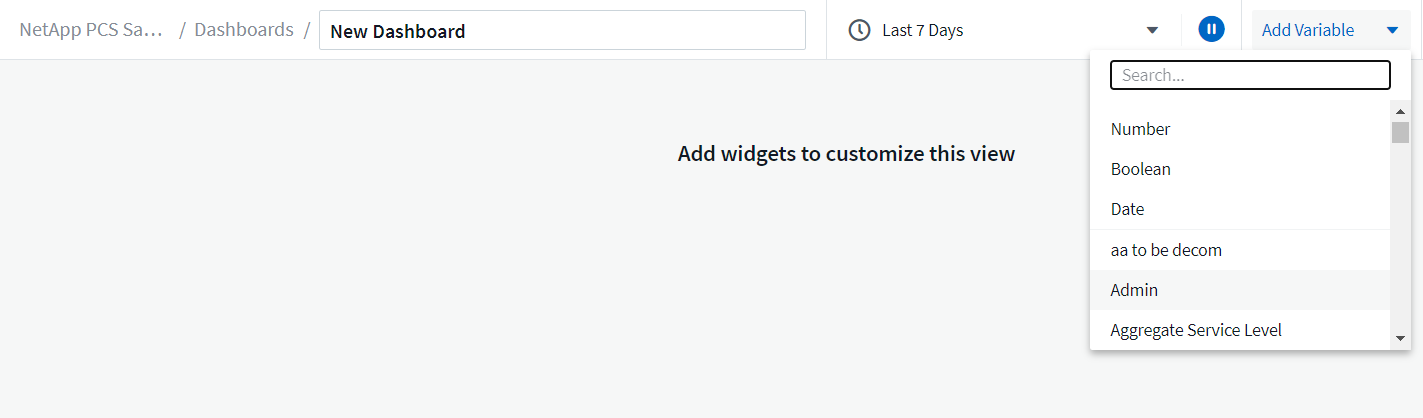
Choose customized variables from the Add Variable menu.
This enables the data presented to be focused to display more specific or specialized factors.
-
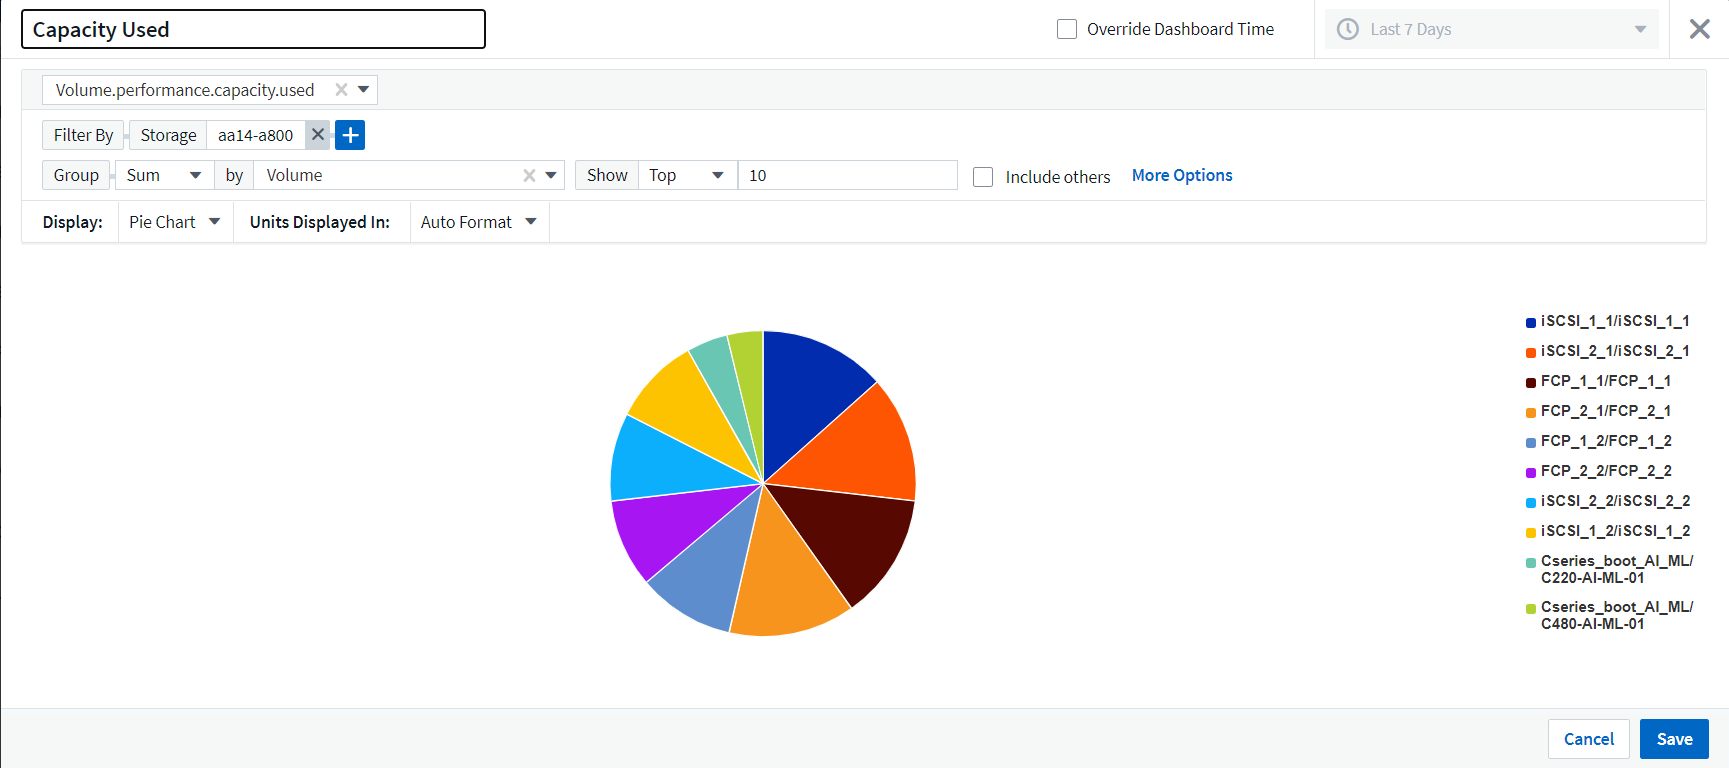
To create a custom dashboard, select the widget type you would like to use, for example, a pie chart to display storage utilization by volume:
-
Select the Pie Chart widget from the Add Widget dropdown list.
-
Name the widget with a descriptive identifier, such as
Capacity Used. -
Select the object you want to display. For example, you can search by the key term volume and select
volume.performance.capacity.used. -
To filter by storage systems, use the filter and type in the name of the storage system in the FlexPod Datacenter solution.
-
Customize the information to be displayed. By default, this selection shows ONTAP data volumes and lists the top 10.
-
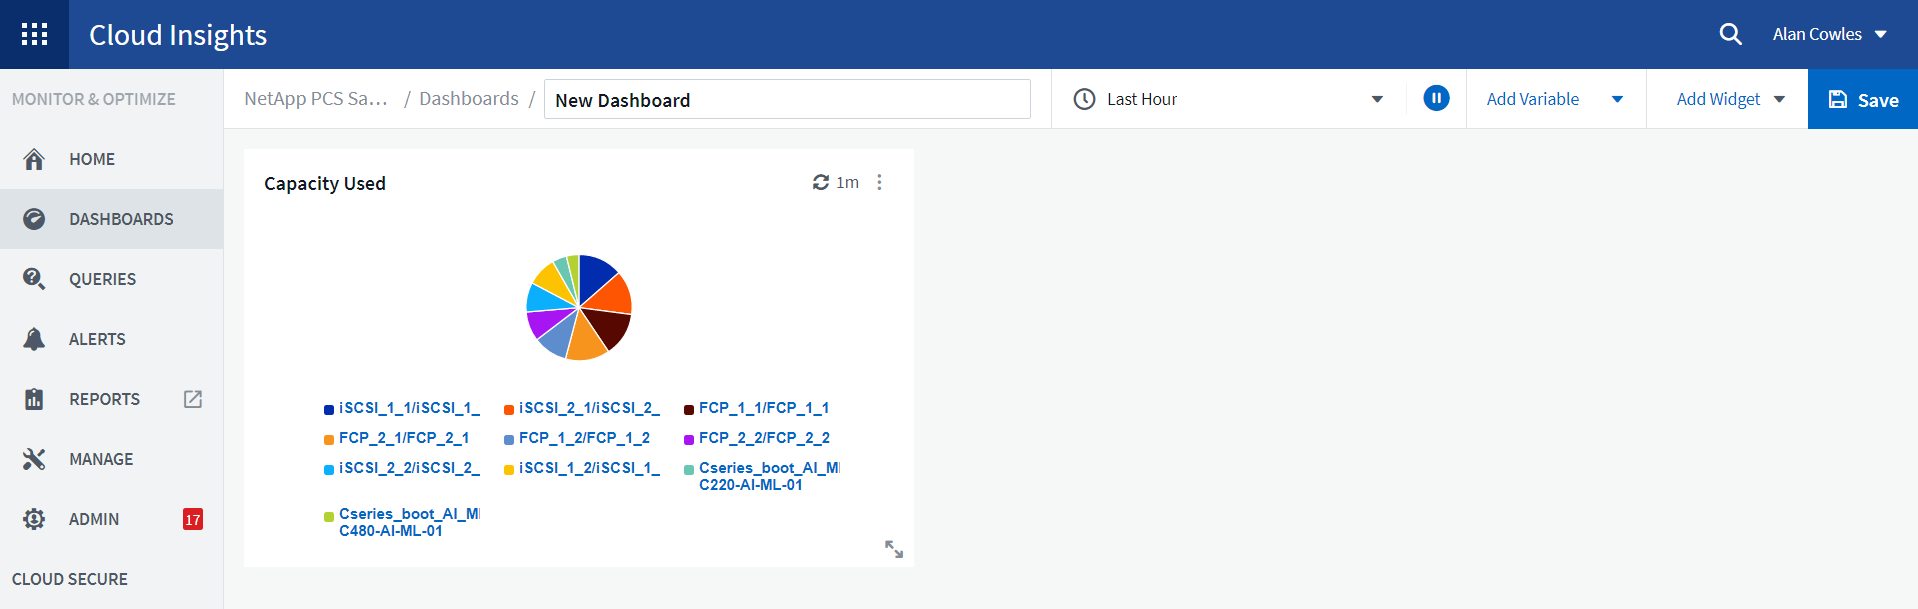
To save the customized dashboard, click the Save.
After saving the custom widget, the browser returns to the New Dashboard page where it displays the newly created widget and allows for interactive action to be taken, such as modifying the data polling period.
-
Advanced troubleshooting
Cloud Insights enables advanced troubleshooting methods to be applied to any storage environment in a FlexPod Datacenter converged infrastructure. Using components of each of the features mentioned above: Digital Advisor integration, default dashboards with real-time statistics, and customized dashboards, issues that might arise are detected early and solved rapidly. Using the list of risks in Digital Advisor, a customer can find reported configuration errors that could lead to issues, as well as reported bugs and patched versions of code that can remedy them. Observing the real-time dashboards on the Cloud Insights home page can help to discover patterns in system performance that could be an early indicator of a problem on the rise and help to resolve it expediently. Lastly, being able to create customized dashboards enables customers to focus on the most important assets in their infrastructure and monitor those directly to ensure that they can meet their business continuity objectives.
Storage optimization
In addition to troubleshooting, it is possible to use the data collected by Cloud Insights to optimize the ONTAP storage system deployed in a FlexPod Datacenter converged infrastructure solution. If a volume shows a high latency, perhaps because several VMs with high performance demands are sharing the same datastore, that information is displayed on the Cloud Insights dashboard. With this information, a storage administrator can choose to migrate one or more VMs either to other volumes, migrate storage volumes between tiers of aggregates, or between nodes in the ONTAP storage system, resulting in a performance optimized environment. The information gleaned from the Digital Advisor integration with Cloud Insights can highlight configuration issues that lead to poorer than expected performance, and provide the recommended corrective action that if implemented, can remediate any issues, and ensure an optimally tuned storage system.