Single-site SmartStore performance
 Suggest changes


This section describes Splunk SmartStore performance on a NetApp StorageGRID controller. Splunk SmartStore moves warm data to remote storage, which in this case is StorageGRID object storage in the performance validation.
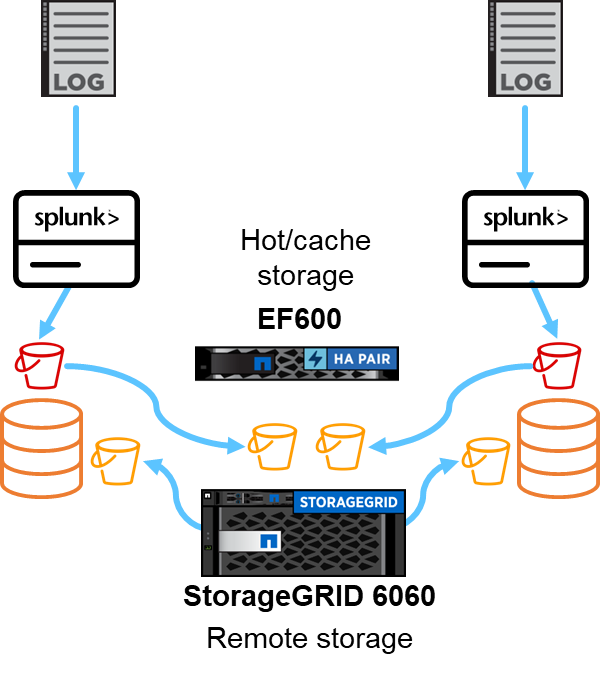
We used EF600 for hot/cache storage and StorageGRID 6060 for remote storage. We used the following architecture for the performance validation. We used two search heads, four heavy forwarders to forward the data to indexers, seven Splunk Event Generators (Eventgens) to generate the real-time data, and 18 indexers to store the data.
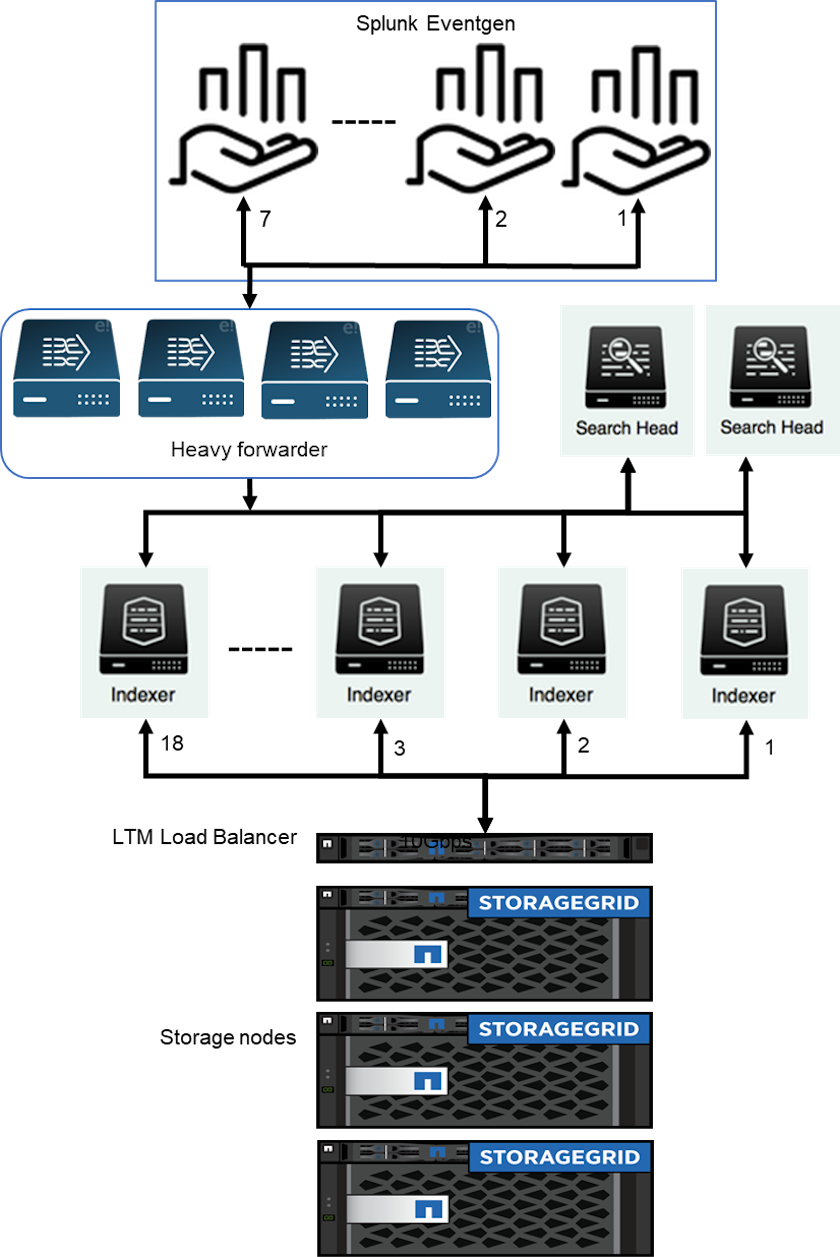
Configuration
This table lists the hardware used for the SmartStorage performance validation.
| Splunk component | Task | Quantity | Cores | Memory | OS |
|---|---|---|---|---|---|
Heavy forwarder |
Responsible for ingesting data and forwarding data to the indexers |
4 |
16 cores |
32GB RAM |
SLED 15 SP2 |
Indexer |
Manages the user data |
18 |
16 cores |
32GB RAM |
SLED 15 SP2 |
Search head |
User front-end searches data in indexers |
2 |
16 cores |
32GB RAM |
SLED 15 SP2 |
Search head deployer |
Handles updates for search head clusters |
1 |
16 cores |
32GB RAM |
SLED 15 SP2 |
Cluster master |
Manages the Splunk installation and indexers |
1 |
16 cores |
32GB RAM |
SLED 15 SP2 |
Monitoring Console and license master |
Performs centralized monitoring of the entire Splunk deployment and manages Splunk licenses |
1 |
16 cores |
32GB RAM |
SLED 15 SP2 |
SmartStore remote store performance validation
In this performance validation, we configured the SmartStore cache in local storage on all the indexers for 10 days of data. We enabled the maxDataSize=auto (750MB bucket size) in Splunk cluster manager and pushed the changes to all the indexers. To measure the upload performance, we ingested 10TB per day for 10 days and rolled over all hot buckets to warm at the same time and captured the peak and average throughput per instance and deployment-wide from the SmartStore Monitoring Console dashboard.
This image shows the data ingested in one day.
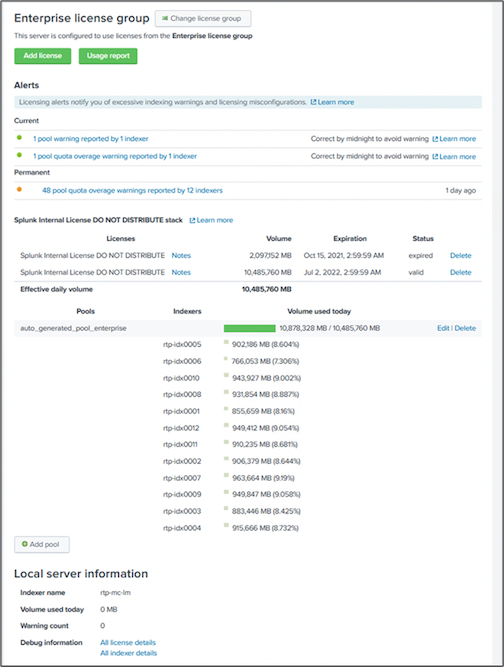
We ran the following command from cluster master (the index name is eventgen-test). Then we captured the peak and average upload throughput per instance and deployment-wide through the SmartStore Monitoring Console dashboards.
for i in rtp-idx0001 rtp-idx0002 rtp-idx0003 rtp-idx0004 rtp-idx0005 rtp-idx0006 rtp-idx0007 rtp-idx0008 rtp-idx0009 rtp-idx0010 rtp-idx0011 rtp-idx0012 rtp-idx0013011 rtdx0014 rtp-idx0015 rtp-idx0016 rtp-idx0017 rtp-idx0018 ; do ssh $i "hostname; date; /opt/splunk/bin/splunk _internal call /data/indexes/eventgen-test/roll-hot-buckets -auth admin:12345678; sleep 1 "; done

|
The cluster master has password-less authentication to all indexers (rtp-idx0001…rtp-idx0018). |
To measure the download performance, we evicted all data from the cache by running the evict CLI twice by using the following command.

|
We ran the following command from cluster master and ran the search from the search head on top of 10 days of data from the remote store from StorageGRID. We then captured the peak and average upload throughput per instance and deployment-wide through the SmartStore Monitoring Console dashboards. |
for i in rtp-idx0001 rtp-idx0002 rtp-idx0003 rtp-idx0004 rtp-idx0005 rtp-idx0006 rtp-idx0007 rtp-idx0008 rtp-idx0009 rtp-idx0010 rtp-idx0011 rtp-idx0012 rtp-idx0013 rtp-idx0014 rtp-idx0015 rtp-idx0016 rtp-idx0017 rtp-idx0018 ; do ssh $i " hostname; date; /opt/splunk/bin/splunk _internal call /services/admin/cacheman/_evict -post:mb 1000000000 -post:path /mnt/EF600 -method POST -auth admin:12345678; “; done
The indexer configurations were pushed from SmartStore cluster master. The cluster master had the following configuration for the indexer.
Rtp-cm01:~ # cat /opt/splunk/etc/master-apps/_cluster/local/indexes.conf
[default]
maxDataSize = auto
#defaultDatabase = eventgen-basic
defaultDatabase = eventgen-test
hotlist_recency_secs = 864000
repFactor = auto
[volume:remote_store]
storageType = remote
path = s3://smartstore2
remote.s3.access_key = U64TUHONBNC98GQGL60R
remote.s3.secret_key = UBoXNE0jmECie05Z7iCYVzbSB6WJFckiYLcdm2yg
remote.s3.endpoint = 3.sddc.netapp.com:10443
remote.s3.signature_version = v2
remote.s3.clientCert =
[eventgen-basic]
homePath = $SPLUNK_DB/eventgen-basic/db
coldPath = $SPLUNK_DB/eventgen-basic/colddb
thawedPath = $SPLUNK_DB/eventgen-basic/thawed
[eventgen-migration]
homePath = $SPLUNK_DB/eventgen-scale/db
coldPath = $SPLUNK_DB/eventgen-scale/colddb
thawedPath = $SPLUNK_DB/eventgen-scale/thaweddb
[main]
homePath = $SPLUNK_DB/$_index_name/db
coldPath = $SPLUNK_DB/$_index_name/colddb
thawedPath = $SPLUNK_DB/$_index_name/thaweddb
[history]
homePath = $SPLUNK_DB/$_index_name/db
coldPath = $SPLUNK_DB/$_index_name/colddb
thawedPath = $SPLUNK_DB/$_index_name/thaweddb
[summary]
homePath = $SPLUNK_DB/$_index_name/db
coldPath = $SPLUNK_DB/$_index_name/colddb
thawedPath = $SPLUNK_DB/$_index_name/thaweddb
[remote-test]
homePath = $SPLUNK_DB/$_index_name/db
coldPath = $SPLUNK_DB/$_index_name/colddb
#for storagegrid config
remotePath = volume:remote_store/$_index_name
thawedPath = $SPLUNK_DB/$_index_name/thaweddb
[eventgen-test]
homePath = $SPLUNK_DB/$_index_name/db
maxDataSize=auto
maxHotBuckets=1
maxWarmDBCount=2
coldPath = $SPLUNK_DB/$_index_name/colddb
#for storagegrid config
remotePath = volume:remote_store/$_index_name
thawedPath = $SPLUNK_DB/$_index_name/thaweddb
[eventgen-evict-test]
homePath = $SPLUNK_DB/$_index_name/db
coldPath = $SPLUNK_DB/$_index_name/colddb
#for storagegrid config
remotePath = volume:remote_store/$_index_name
thawedPath = $SPLUNK_DB/$_index_name/thaweddb
maxDataSize = auto_high_volume
maxWarmDBCount = 5000
rtp-cm01:~ #
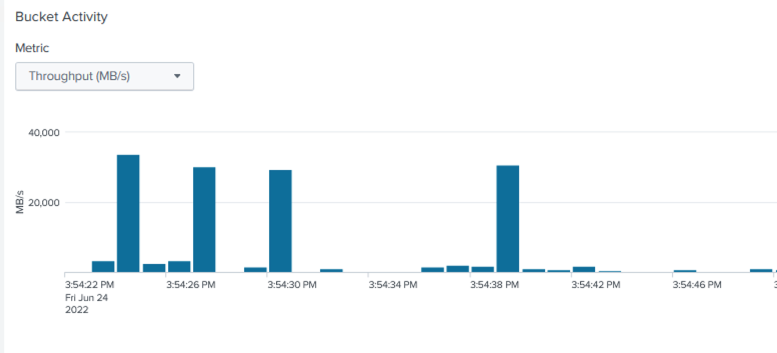
We ran the following search query on the search head to collect the performance matrix.
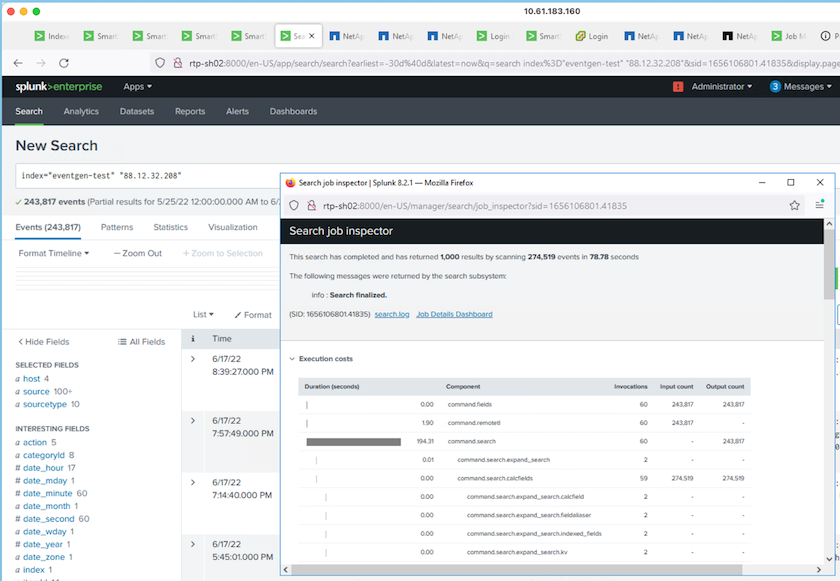
We collected the performance information from the cluster master. The peak performance was 61.34GBps.

The average performance was approximately 29GBps.
StorageGRID performance
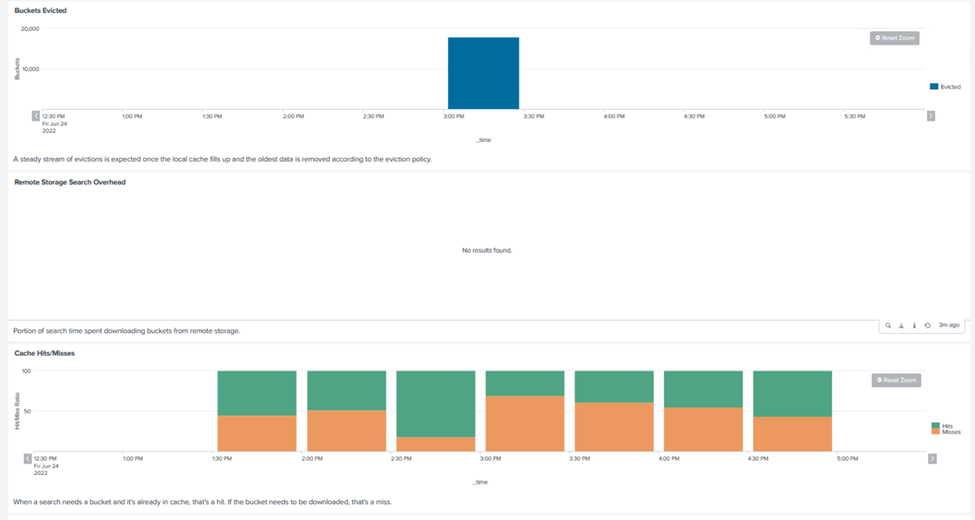
SmartStore performance is based on searching for specific patterns and strings from large amounts of data. In this validation, the events are generated using Eventgen on a specific Splunk index (eventgen-test) through the search head, and the request goes to StorageGRID for most of the queries. The following image shows the hits and misses of the query data. The hits data is from the local disk and the misses data is from the StorageGRID controller.

|
The green color shows the hits data and the orange color shows the misses data. |
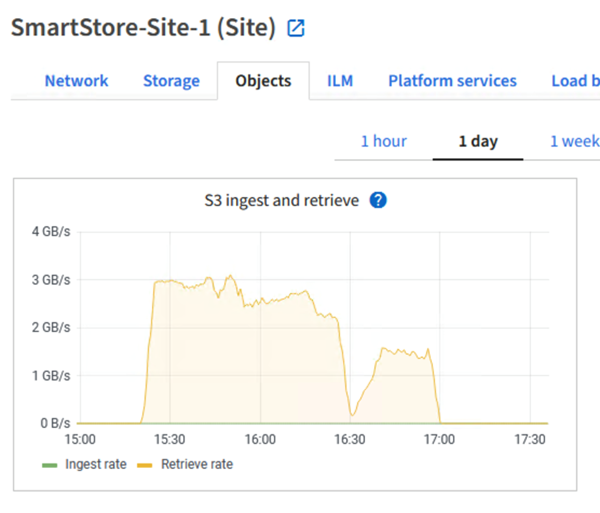
When the query runs for the search on StorageGRID, the time for the S3 retrieve rate from StorageGRID is shown in the following image.
StorageGRID hardware usage
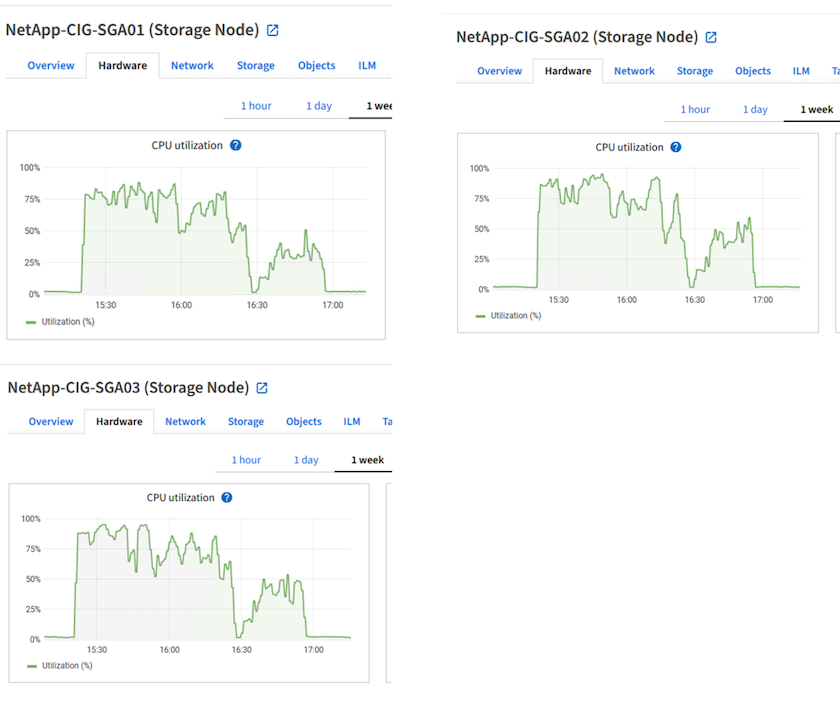
The StorageGRID instance has one load balancer and three StorageGRID controllers. CPU utilization for all three controllers is from 75% to 100%.
SmartStore with NetApp storage controller - benefits for the customer
-
Decoupling compute and storage. The Splunk SmartStore decouples compute and storage, which helps you to scale them independently.
-
Data on-demand. SmartStore brings data close to compute on-demand and provides compute and storage elasticity and cost efficiency to achieve longer data retention at scale.
-
AWS S3 API compliant. SmartStore uses the AWS S3 API to communicate with restore storage, which is an AWS S3 and S3 API-compliant object store such as StorageGRID.
-
Reduces storage requirement and cost. SmartStore reduces the storage requirements for aged data (warm/cold). It only needs a single copy of data because NetApp storage provides data protection and takes care of failure and high availability.
-
Hardware failure. Node failure in a SmartStore deployment does not make the data inaccessible and has a much faster indexer recovery from hardware failure or data imbalance.
-
Application and data-aware cache.
-
Add-remove indexers and setup-teardown cluster on-demand.
-
Storage tier is no longer tied to hardware.

