NetApp All-Flash SAN Array with VMware vSphere 8
 Suggest changes


NetApp Cloud Insights is a cloud-based infrastructure monitoring and analytics platform designed to provide comprehensive visibility and insights into the performance, health, and costs of IT infrastructures, both on-premises and in the cloud. Key features of NetApp Cloud Insights include real-time monitoring, customizable dashboards, predictive analytics, and cost optimization tools, allowing organizations to effectively manage and optimize their on-premises and cloud environments.
Author: Josh Powell - NetApp Solutions Engineering
Monitoring On-Premises Storage with NetApp Cloud Insights
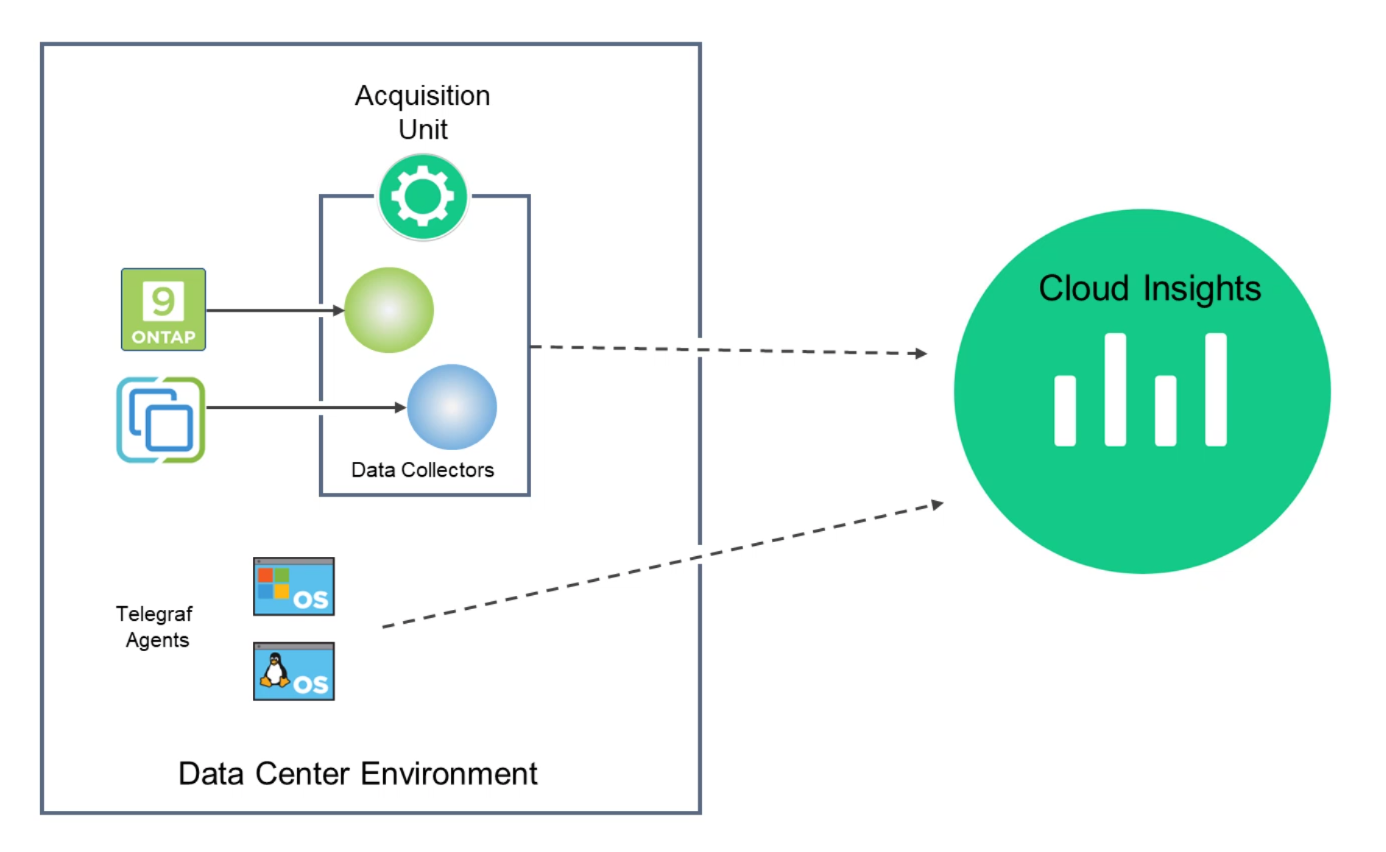
NetApp Cloud Insights operates through Acquisition Unit software, which is set up with data collectors for assets such as VMware vSphere and NetApp ONTAP storage systems. These collectors gather data and transmit it to Cloud Insights. The platform then utilizes a variety of dashboards, widgets, and metric queries to organize the data into insightful analyses for users to interpret.
Cloud Insights architecture diagram:
Solution Deployment Overview
This solution provides an introduction to monitoring on-premises VMware vSphere and ONTAP storage systems using NetApp Cloud Insights.
This list provides the high level steps covered in this solution:
-
Configure Data Collector for a vSphere cluster.
-
Configure Data Collector for an ONTAP storage system.
-
Use Annotation Rules to tag assets.
-
Explore and correlate assets.
-
Use a Top VM Latency dashboard to isolate noisy neighbors.
-
Identify opportunities to rightsize VMs.
-
Use queries to isolate and sort metrics.
Prerequisites
This solution uses the following components:
-
NetApp All-Flash SAN Array A400 with ONTAP 9.13.
-
VMware vSphere 8.0 cluster.
-
NetApp Cloud Insights account.
-
NetApp Cloud Insights Acqusition Unit software installed on a local VM with network connectivity to assets for data collection.
Solution Deployment
Configure Data Collectors
To configure Data Collectors for VMware vSphere and ONTAP storage systems complete the following steps:
Add a Data Collector for an ONTAP storage systems
-
Once logged into Cloud Insights, navigate to Observability > Collectors > Data Collectors and press the button to install a new Data Collector.

-
From here search for ONTAP and click on ONTAP Data Management Software.

-
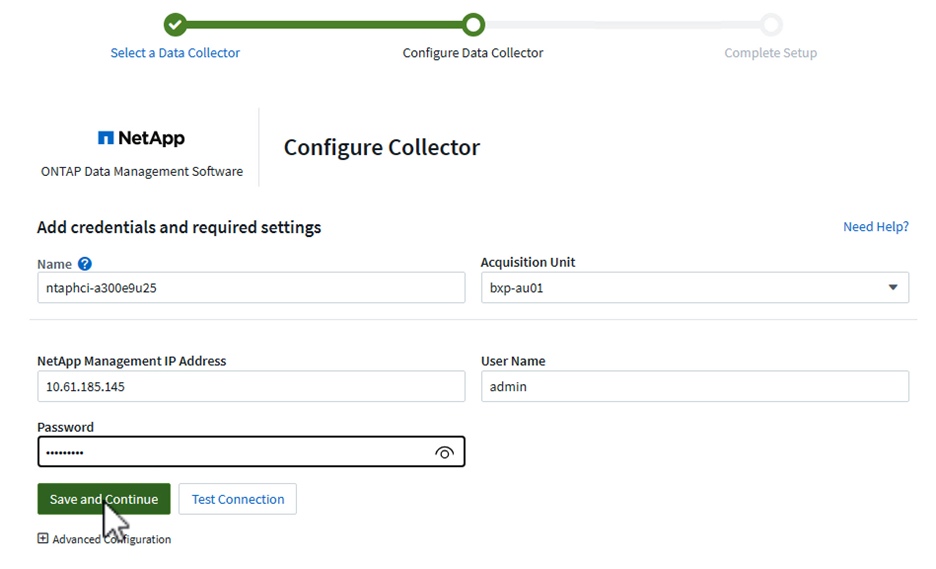
On the Configure Collector page fill out a name for the collector, specify the correct Acquisition Unit and provide the credentials for the ONTAP storage system. Click on Save and Continue and then Complete Setup at the bottom of the page to complete the configuration.
Add a Data Collector for a VMware vSphere cluster
-
Once again, navigate to Observability > Collectors > Data Collectors and press the button to install a new Data Collector.

-
From here search for vSphere and click on VMware vSphere.

-
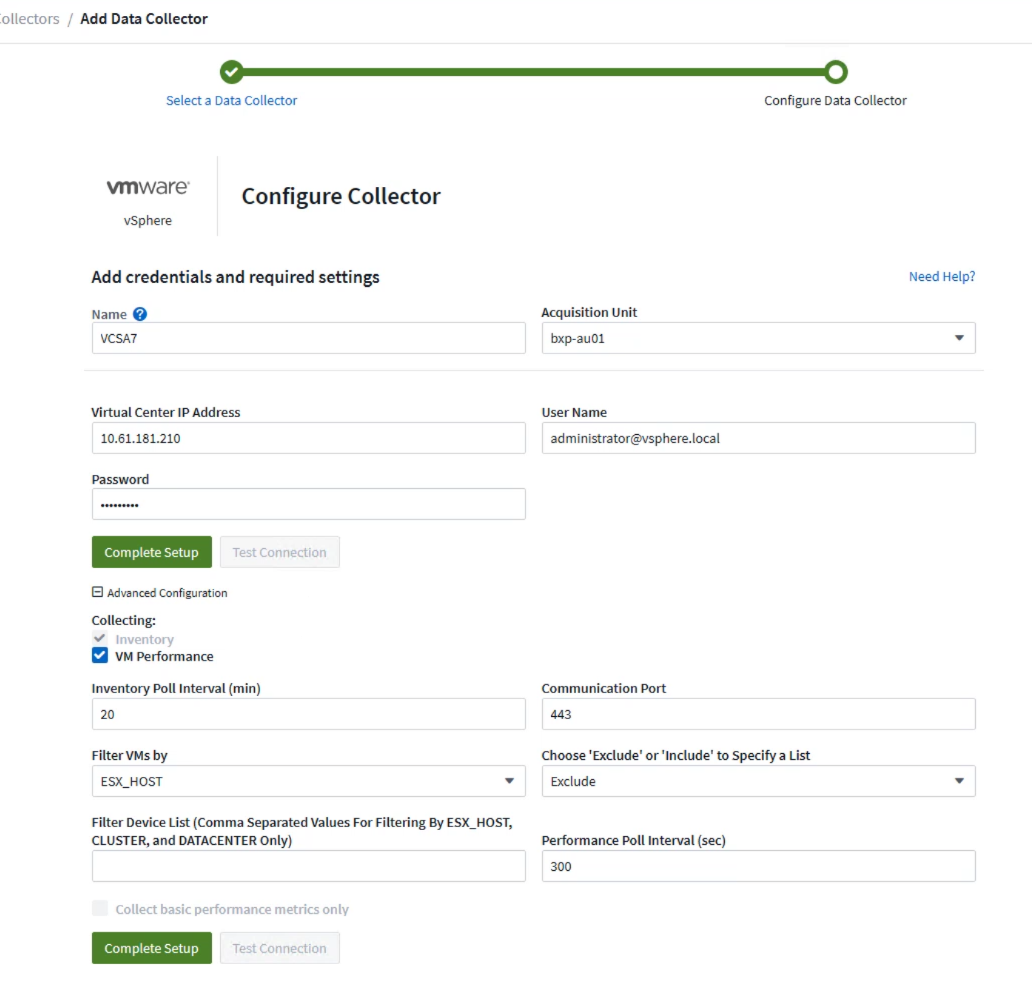
On the Configure Collector page fill out a name for the collector, specify the correct Acquisition Unit and provide the credentials for the vCenter server. Click on Save and Continue and then Complete Setup at the bottom of the page to complete the configuration.
Add Annotations to assets
Annotations are a useful method of tagging assets so that they can be filtered and otherwise identified in the various views and metric queries available in Cloud Insights.
In this section, annotations will be added to virtual machine assets for filtering by Data Center.
Use Annotation Rules to tag assets
-
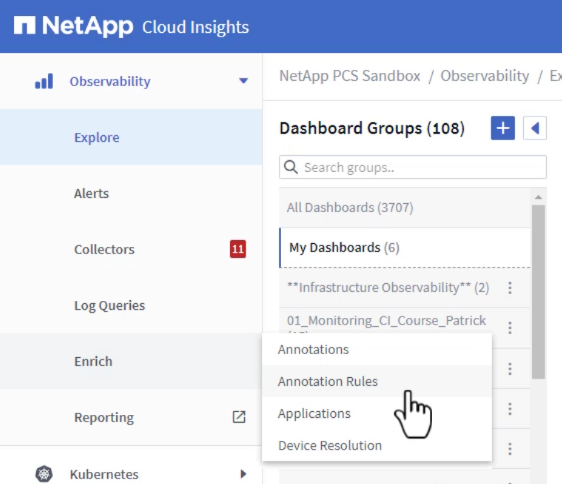
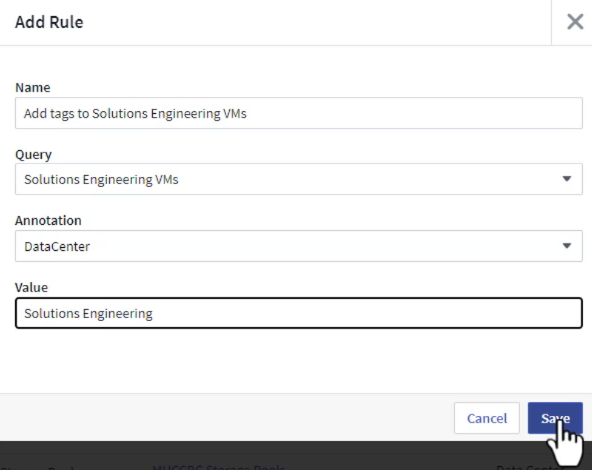
In the left-hand menu, navigate to Observability > Enrich > Annotation Rules and click on the + Rule button in the upper right to add a new rule.
-
In the Add Rule dialog box fill in a name for the rule, locate a query to which the rule will be applied, the annotation field affected, and the value to be populated.
-
Finally, in the upper right hand corner of the Annotation Rules page click on Run All Rules to run the rule and apply the annotation to the assets.

Explore and correlate assets
Cloud Insights draws logical conclusions about the assets that are running together on your storage systems and vsphere clusters.
This sections illustrates how to use dashboards to correlate assets.
Correlating assets from a storage performance Dashboard
-
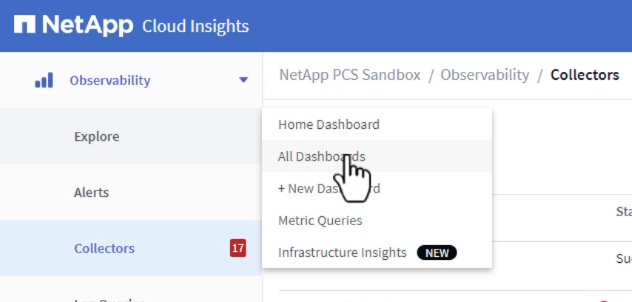
In the left-hand menu, navigate to Observability > Explore > All Dashboards.
-
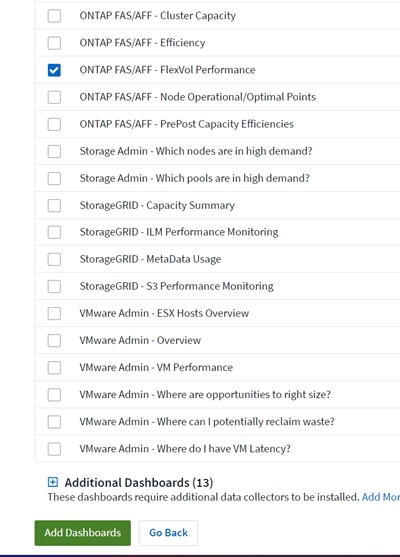
Click on the + From Gallery button to view a list of ready-made dashboards that can be imported.

-
Choose a dashboard for FlexVol performance from the list and click on the Add Dashboards button at the bottom of the page.
-
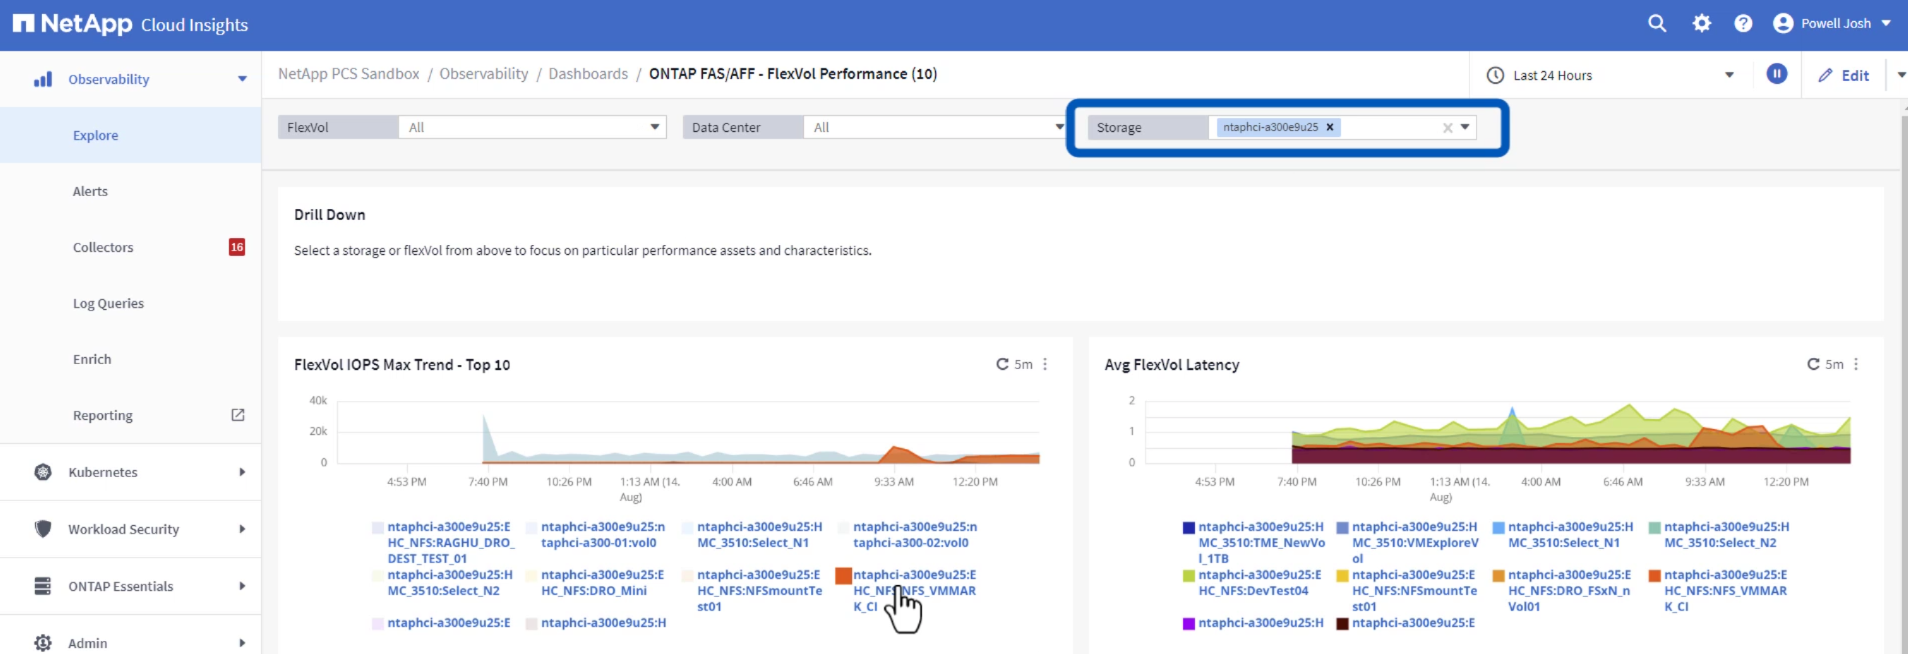
Once imported, open the dashboard. From here you can see various widgets with detailed performance data. Add a filter to view a single storage system and select a storage volume to drill into it's details.
-
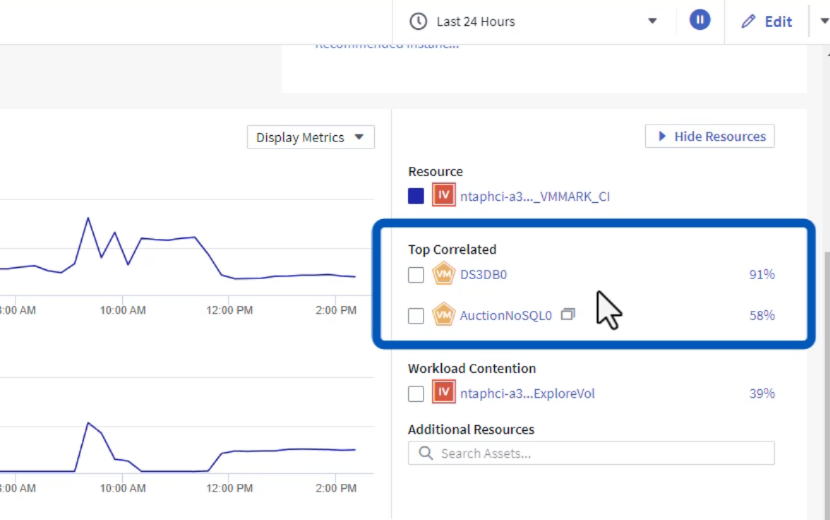
From this view you can see various metrics related to this storage volume and the top utilized and correlated virtual machines running on the volume.
-
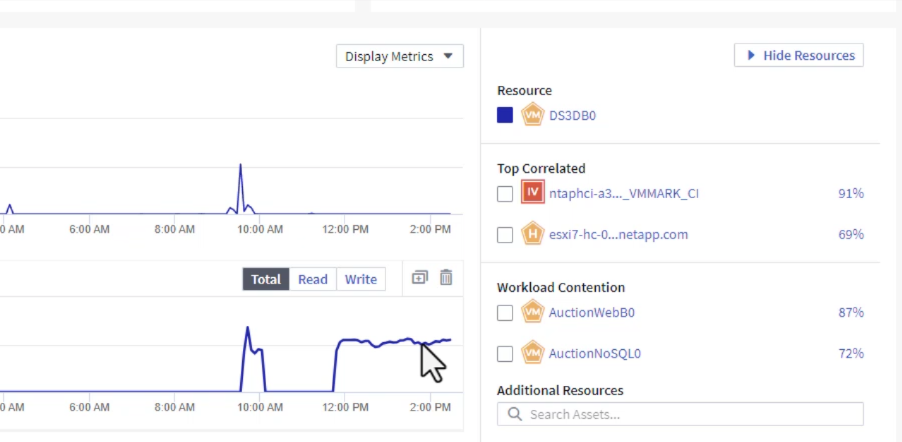
Clicking on the VM with the highest utilization drills into the metrics for that VM to view any potential issues.
Use Cloud Insights to identify noisy neighbors
Cloud Insights features dashboards that can easily isolate peer VMs that are negatively impacting other VMs running on the same storage volume.
Use a Top VM Latency dashboard to isolate noisy neighbors
-
In this example access a dashboard available in the Gallery called VMware Admin - Where do I have VM Latency?

-
Next, filter by the Data Center annotation created in a previous step to view a subset of assets.

-
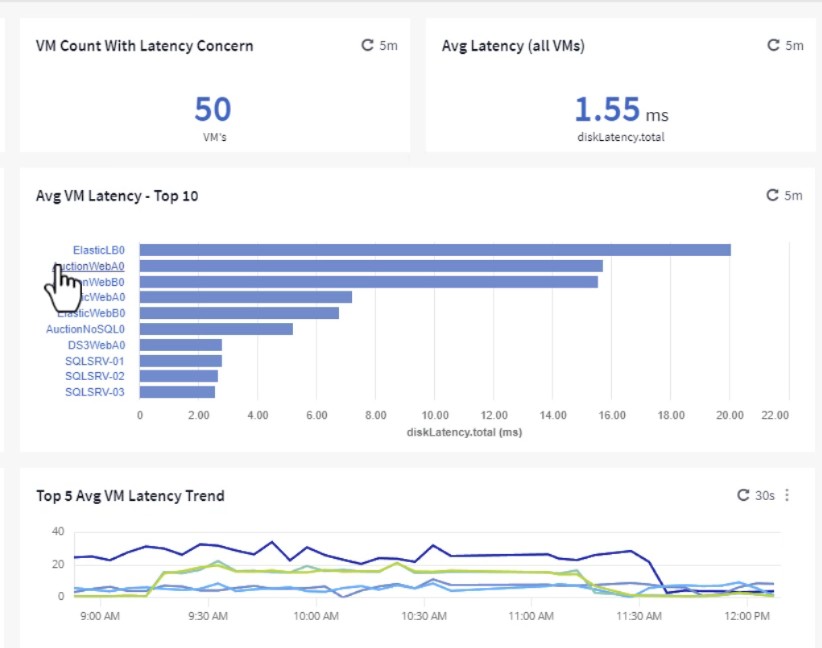
This dashboard shows a list of the top 10 VMs by average latency. From here click on the VM of concern to drill into its details.
-
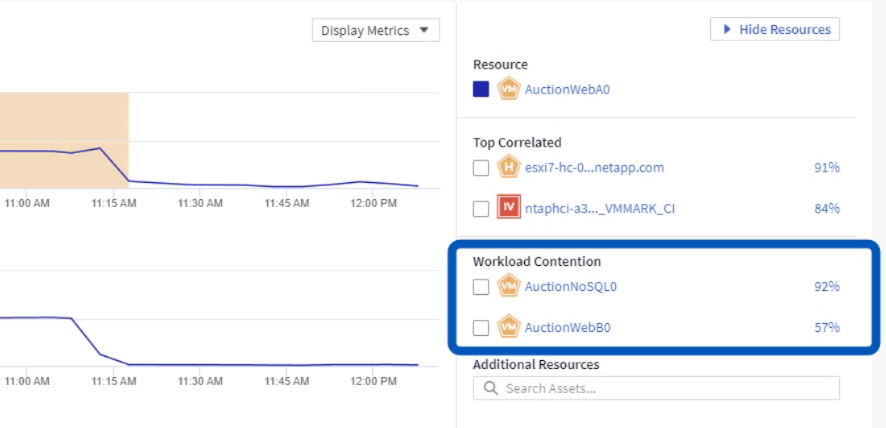
The VMs potentially causing workload contention are listed and available. Drill into these VMs performance metrics to investigate any potential issues.
View over and under utilized resources in Cloud Insights
By matching VM resources to actual workload requirements, resource utilization can be optimized, leading to cost savings on infrastructure and cloud services. Data in Cloud Insights can be customized to easily display over or under utilized VMs.
Identify opportunities to right size VMs
-
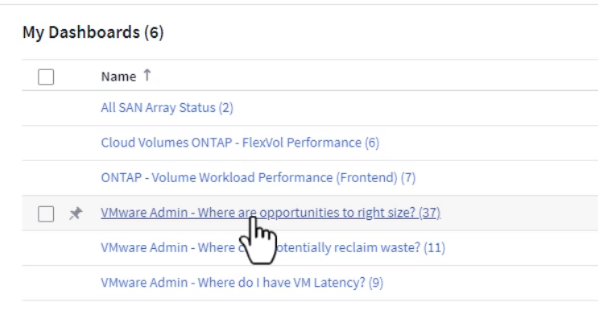
In this example access a dashboard available in the Gallery called VMware Admin - Where are opportunities to right size?
-
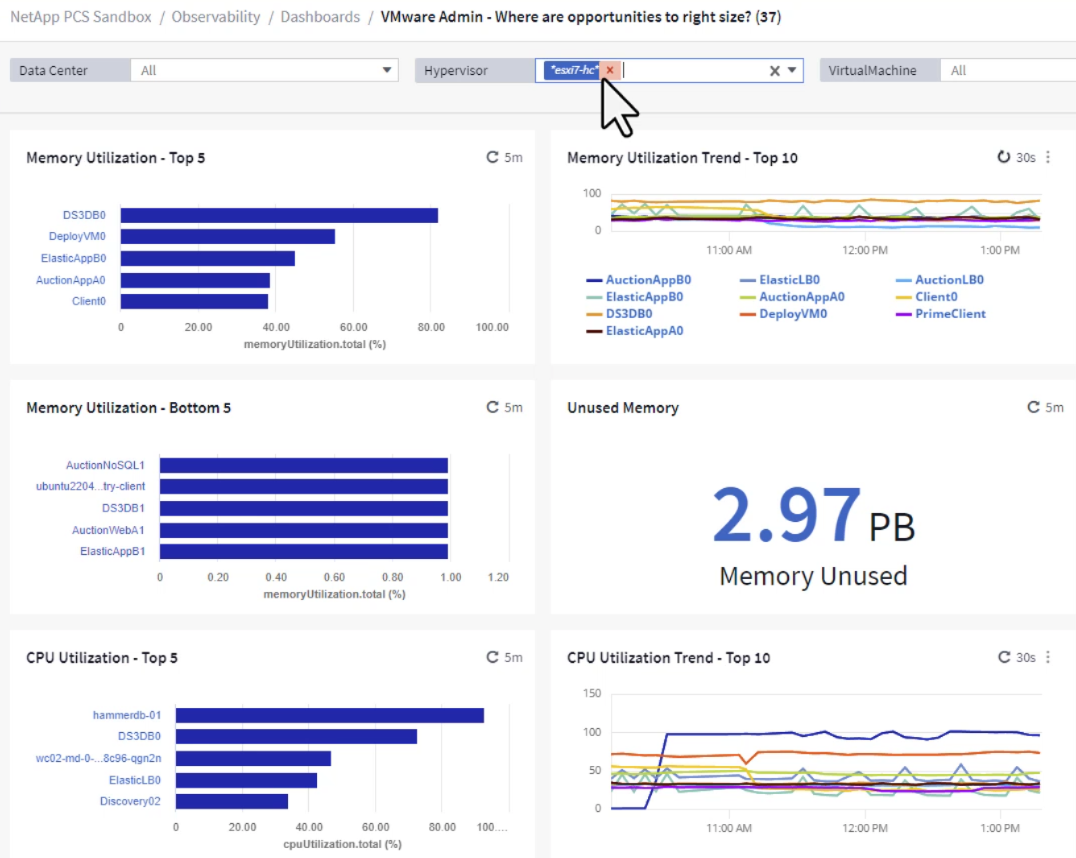
First filter by all of the ESXi hosts in the cluster. You can then see ranking of the top and bottom VMs by memory and CPU utilization.
-
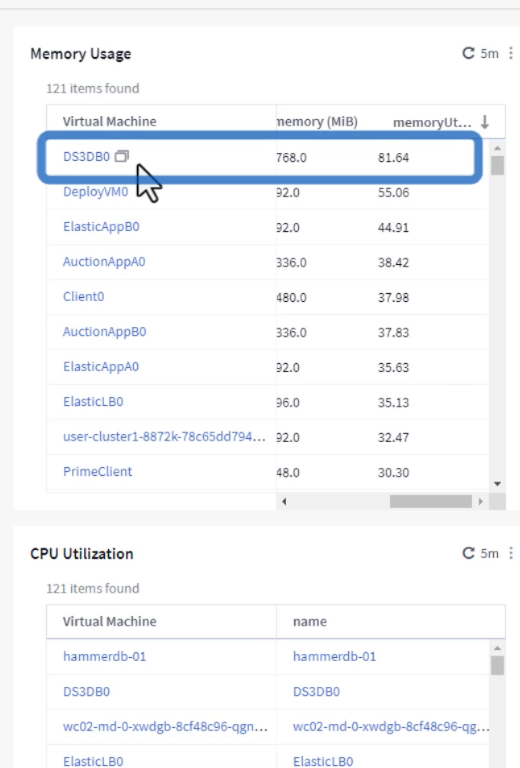
Tables allow sorting and provide more detail based on the columns of data chosen.
-
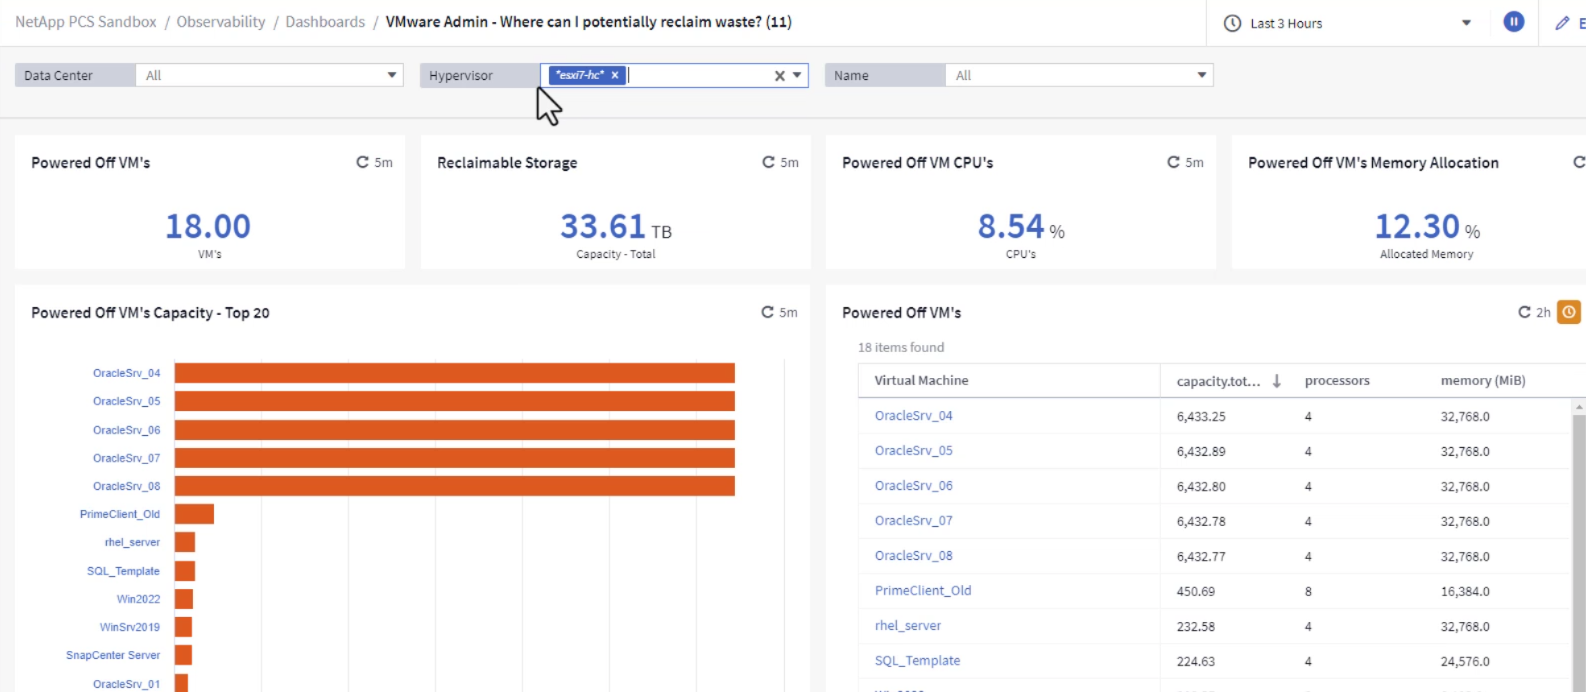
Another dashboard called VMware Admin - Where can I potentially reclaim waste? shows powered off VM's sorted by their capacity use.
Use queries to isolate and sort metrics
The amount of data captured by Cloud Insights is quite comprehensive. Metric queries provide a powerful way to sort and organize large amounts of data in useful ways.
View a detailed VMware query under ONTAP Essentials
-
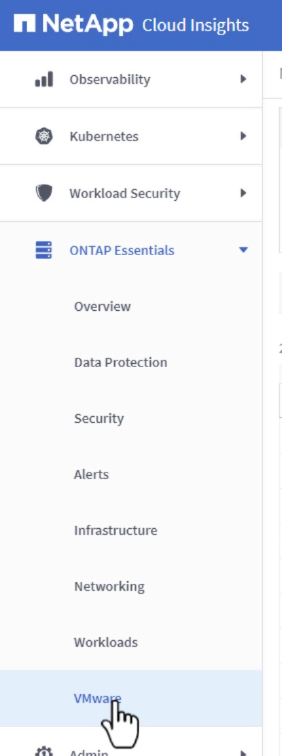
Navigate to ONTAP Essentials > VMware to access a comprehensive VMware metric query.
-
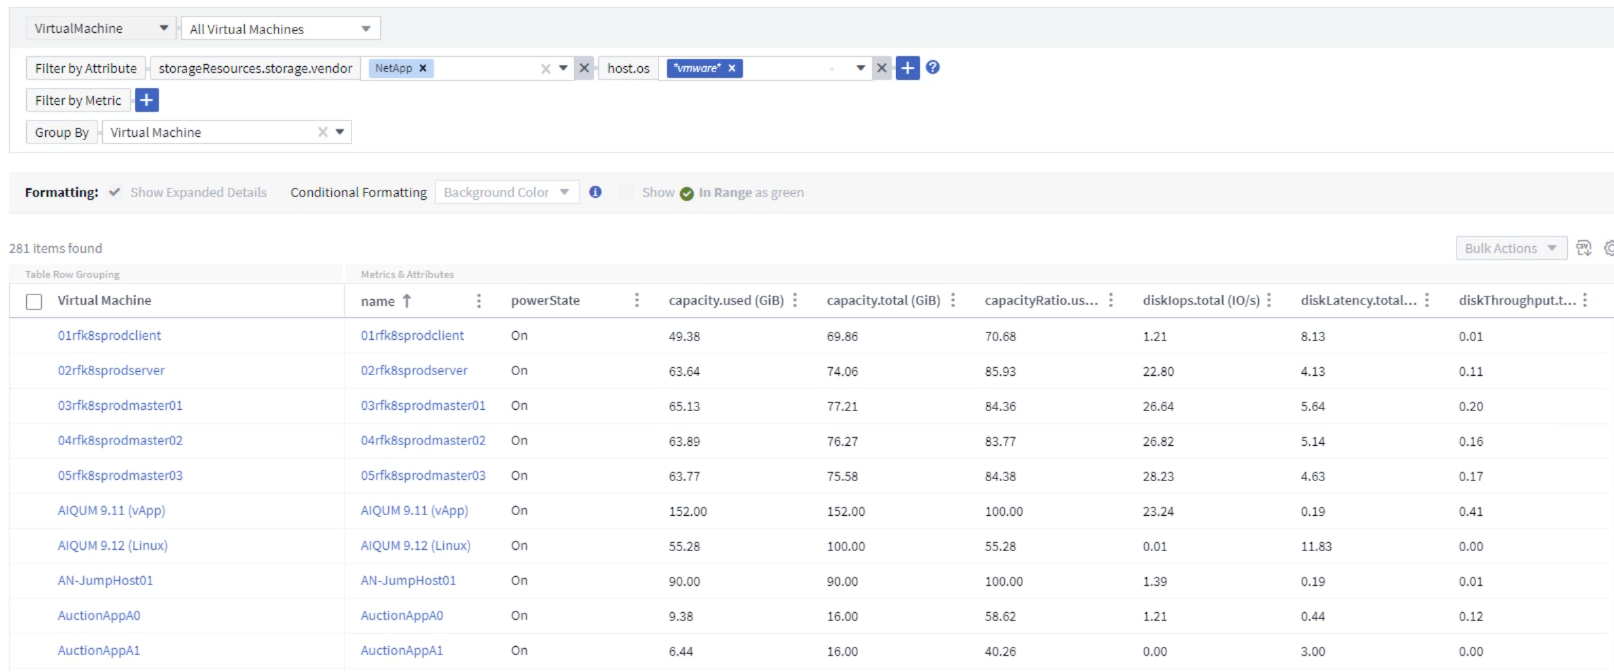
In this view you are presented with multiple options for filtering and grouping the data at the top. All columns of data are customizable and additional columns can be easily added.
Conclusion
This solution was designed as a primer to learn how to get started with NetApp Cloud Insights and show some of the powerful capabilities that this observability solution can provide. There are hundreds of dashboards and metric queries built into the product which makes it easy to get going immediately. The full version of Cloud Insights is available as a 30-day trial and the basic version is available free to NetApp customers.
Additional Information
To learn more about the technologies presented in this solution refer to the following additional information.


