How graphs of performance data work
 Suggest changes


Unified Manager uses graphs or charts to show you volume performance statistics and events over a specified period of time.
The graphs enable you to customize the range of time for which to view data. The data is displayed with the time frame on the horizontal axis of the graph and the counters on the vertical axis, with point intervals along the graph lines. The vertical axis is dynamic; the values adjust based on the peaks of the expected or actual values.
Selecting time frames
On the Performance/Volume Details page, the Historic data chart enables you to select a time frame for all graphs on the page. The 1d, 5d, 10d, and 30d buttons specify 1 day through 30 days (1 month) and the Custom button enables you to specify a custom time range within that 30 days. Each point on a graph represents a 5-minute collection interval, and a maximum of 30 days of historical performance data is retained. Note that intervals also account for network delays and other anomalies.

In this example, the Historic data chart has a time frame set to the beginning and the end of the month of March. In the selected time frame, all historic data before March is grayed out.
Viewing data point information
To view data point information on a graph, you can position the cursor over a specific point within the graph, and a pop-up box displays listing the value and date and time information.

In this example, positioning the cursor over the IOPS chart on the Performance/Volume Details page displays the response time and operations values between 3:50 a.m. and 3:55 a.m. on October 20th.
Viewing performance event information
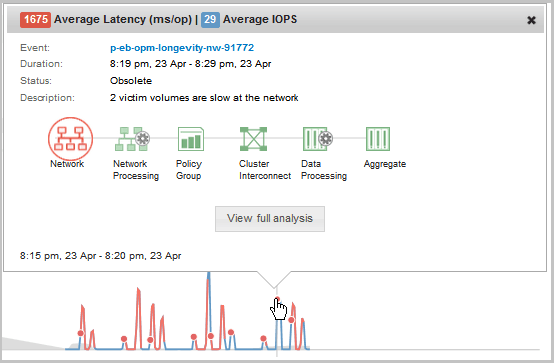
To view event information on a graph, you can position the cursor over an event icon to view summary information in a pop-up box, or you can click the event icon for more detailed information.

In this example, on the Performance/Volume Details page, clicking an event icon on the Latency chart displays detailed information about the event in a pop-up box. The event is also highlighted in the Events List.


