Understanding the Cluster View dashboard
 Suggest changes


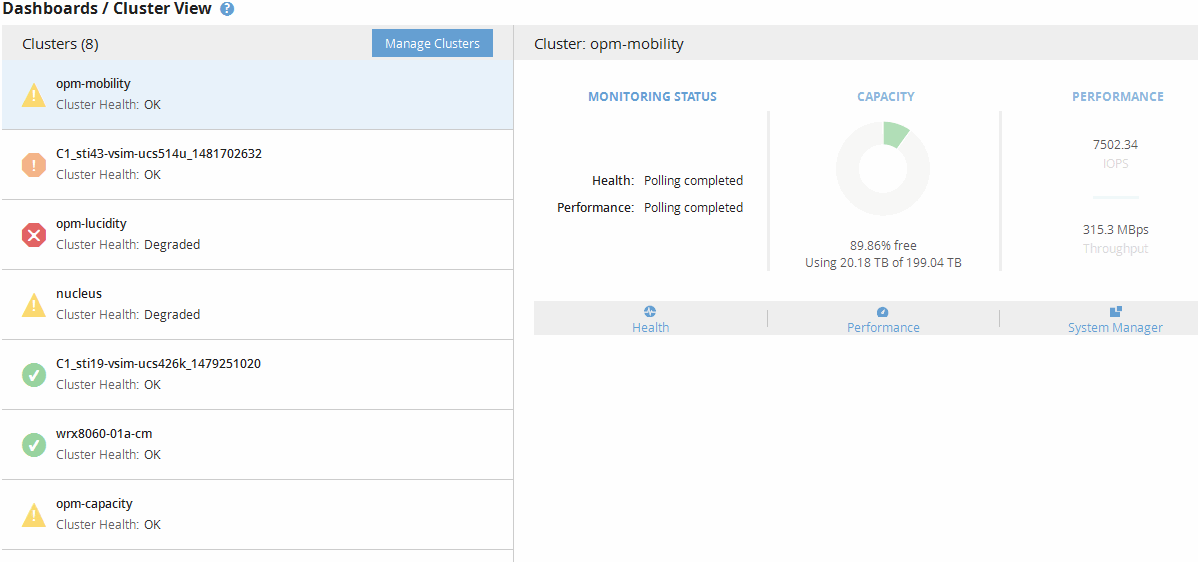
The Unified ManagerCluster View overview dashboard provides high-level information about the health of the clusters you are managing. The Cluster View dashboard consists of two major sections: Managed Clusters (on the left) and Cluster Details (on the right).
The following image shows an example of a Unified ManagerCluster View dashboard that is monitoring eight clusters:

The status icon next to each cluster name can be in the following states:
-
Critical (
 ): One or more active critical events have been reported for the cluster.
 -
Error (
 ): One or more active error events have been reported for the cluster.
 -
Warning (
 ): One or more active warning events have been reported for the cluster.
 -
Normal (
 ): No active events have been reported for the cluster.

|
The color indicates whether active (new or acknowledged) events exist for the object. Events that are no longer active, called obsolete events, do not affect the color of the icon. |
To display additional information about a cluster, you can perform one of the following actions:
-
You can click a cluster name to display overview information on the monitoring status, capacity status, and performance status of the cluster.
-
You can click Manage Clusters to display the Configuration/Cluster Data Sources page, where you can view detailed status information for all the clusters being managed by this instance of Unified Manager.


