

View status information
 Suggest changes
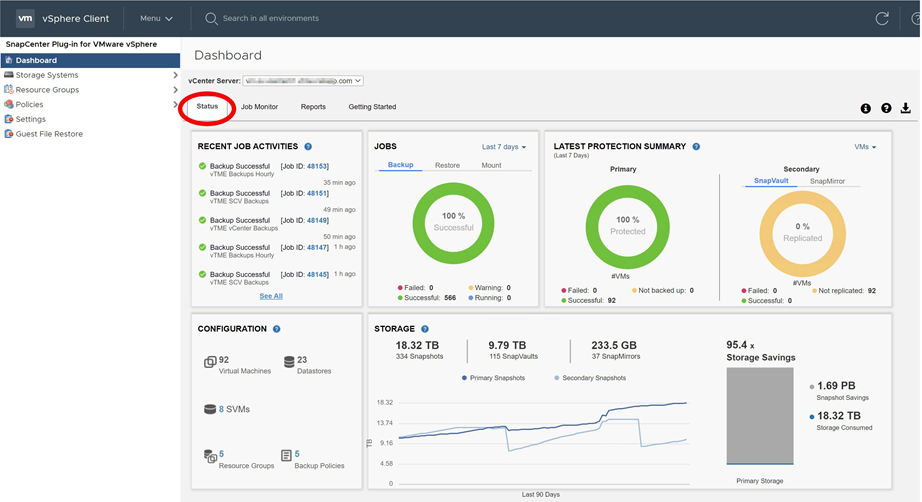
You can view status information on the vSphere web client Dashboard. Status information is updated once an hour.
-
In the left Navigator pane of the vSphere web client, click Dashboard, select a vCenter Server, and then click the Status tab.
-
View overview status information or click a link for more details, as listed in the following table.
This dashboard tile… Displays the following information… Recent job activities
The three to five most recent backup, restore, and mount jobs.
-
Click on a job ID to see more details about that job.
-
Click See all to go to the Job Monitor tab for more details on all jobs.
Jobs
A count of each job type (backup, restore, and mount) performed within the selected time window.
Hover the cursor over a section of the chart to see more details for that category.Latest Protection Summary
Summaries of the data protection status of primary and secondary VMs or datastores within the selected time window.
-
Click the drop-down menu to select VMs or Datastores.
-
For secondary storage, select SnapVault or SnapMirror.
-
Hover the cursor over a section of a chart to see the count of VMs or Datastores in that category. In the Successful category, the most recent backup is listed for each resource.
-
You can change the time window by editing the configuration file. The default is 7 days. For more information, see Customize your configuration.
-
Internal counters are updated after each primary or secondary backup. The dashboard tile is refreshed every six hours. The refresh time cannot be changed.
Note: If you use a mirror-vault protection policy, then the counters for the protection summary are displayed in the SnapVault summary chart, not in the SnapMirror chart.
Configuration
The total number of each type of object managed by the SnapCenter Plug-in for VMware vSphere.
Storage
The total number of Snapshot copies, SnapVault, and SnapMirror Snapshot copies, generated and the amount of storage used for primary and secondary Snapshot copies. The line graph separately plots primary and secondary storage consumption on a day-by-day basis over a rolling 90-day period. Storage information is updated once every 24 hours at 1:08 A.M.
Storage Savings is the ratio of logical capacity (Snapshot copy savings plus storage consumed) to the physical capacity of primary storage. The bar chart illustrates the storage savings.Hover the cursor over a line on the chart to see detailed day-by-day results.
-