

Busiest Volumes
 Suggest changes
From the QoS Management > Busiest Volumes page, available from the side panel for a selected cluster, you can view the ten volumes with the highest throughput for a selected node and time range in the cluster.
Learn about viewing the busiest volume information:
View graphs and select date ranges
After selecting the node from the drop-down list, the ten volumes with the highest throughput on that node are displayed. For each volume, you can view the Throughput, Average IO Size, IOPS, and Latency graphs; to see the last graph, you might need to scroll down the page. To switch between volumes, select the thumbnail layouts on the left. When you select a different node, these graphs change to the newly selected node.
The graphs and date ranges in SolidFire Active IQ are seamlessly integrated with each other. When selecting a date range, the graphs on that page adjust to the range selected. The default date range displayed for each graph is seven days. You can select a date range from the calendar drop-down box or from a set of pre-defined ranges. You can also select a desired interval by brushing directly over the bar graph at the bottom. Date ranges are calculated using the current browser time (at the time of selection) and the configured amount of time. When you change the selected date range for a node, the ten busiest volumes displayed might also change.
Expand the graph example
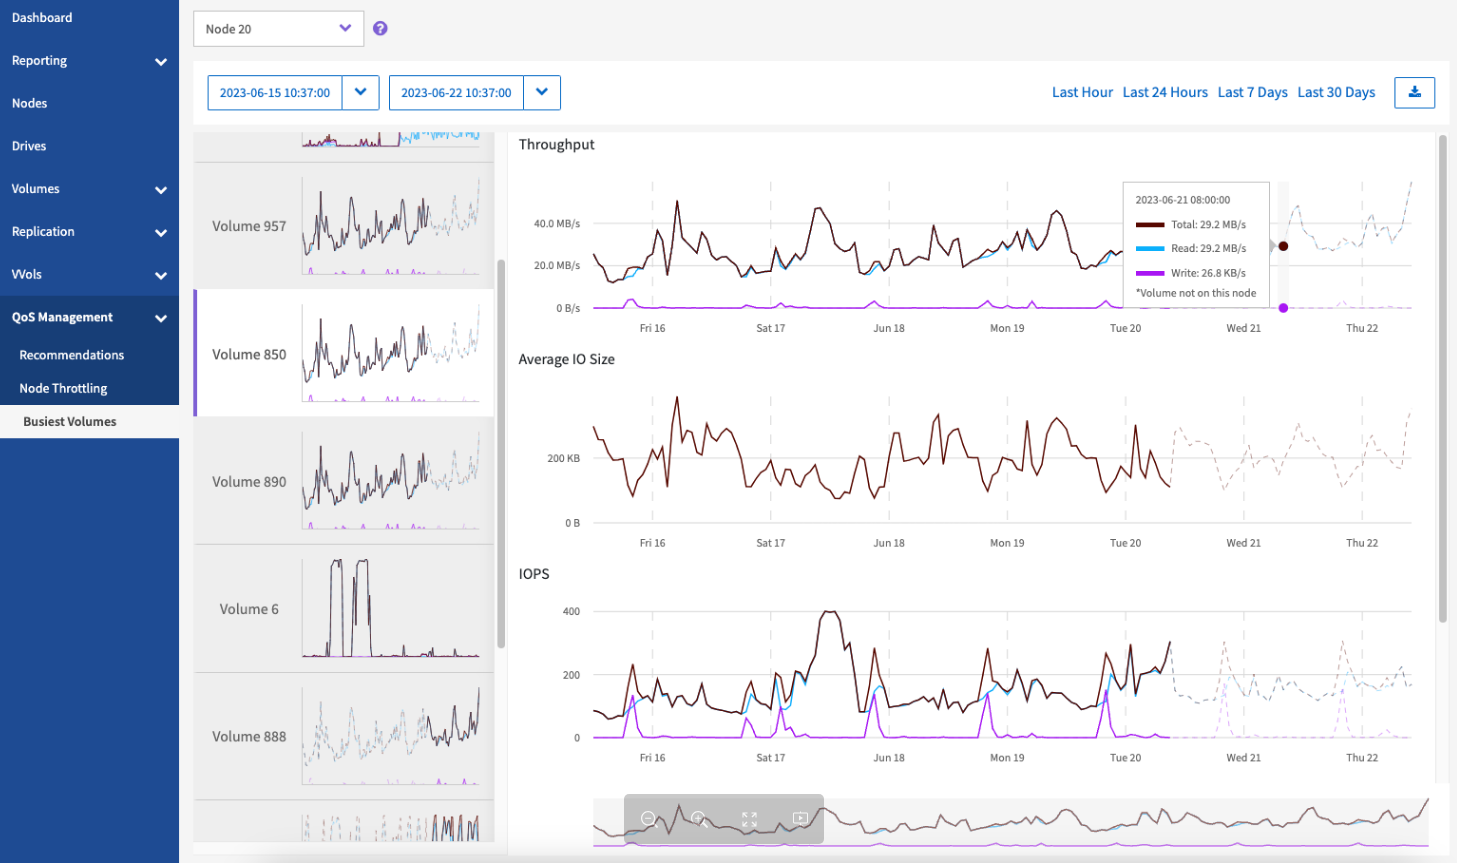
Position the mouse pointer at any point in the graph to see point-in-time details for the read, write, and total operations. If a volume is not present on the node for part of the selected time range, it is represented by a dotted line
Export busiest node data
You can export graph data to a comma-separated values (CSV) format. Only the information displayed in the graph is exported.
-
In a list view or graph, select the
 icon.
icon.