

Node Throttling
 Suggest changes
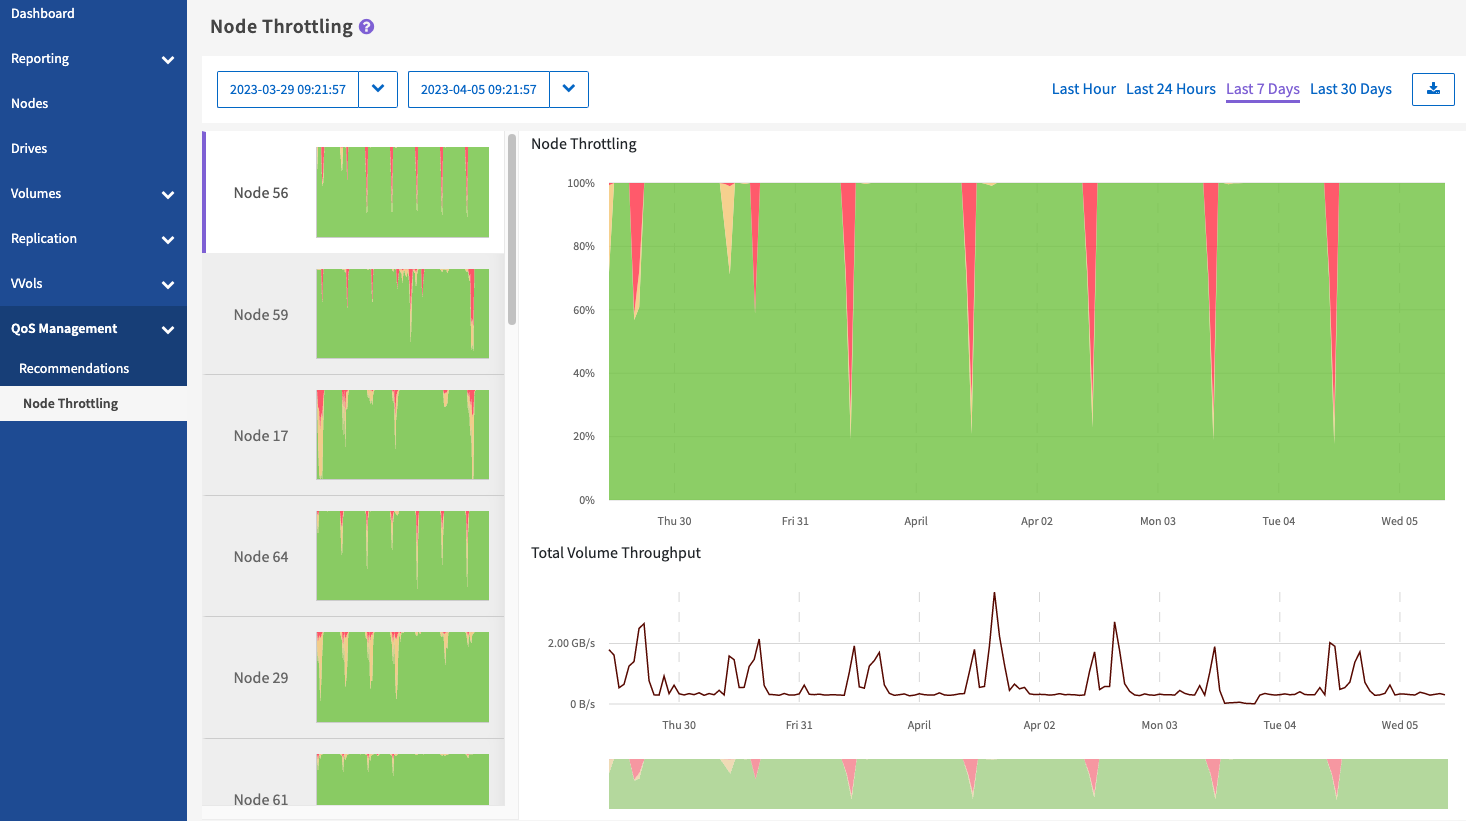
From the QoS Management > Node Throttling page, available from the side panel for a selected cluster, you can view the percent throttling for the nodes in the cluster. The nodes are listed as thumbnail layouts on the left side of the display and are ordered depending on the degree of throttling for a selected time range.
Learn about viewing node throttling information:
View graphs and select date ranges
The graphs and date ranges in SolidFire Active IQ are seamlessly integrated with each other. When selecting a date range, the Node Throttling and Total Volume Throughput graphs on that page adjust to the range selected. The default date range displayed for each graph is seven days. When you select a node from the graph selection tabs, these graphs change to the newly selected node.
You can select a date range from the calendar drop-down box or from a set of pre-defined ranges. Date ranges are calculated using the current browser time (at the time of selection) and the configured amount of time. You can also select a desired interval by brushing directly over the bar graph at the bottom. To switch between graphs, select the thumbnail layouts on the left.
The Node Throttling graph displays node throttling over the selected time period based on the minimum and maximum IOPS settings for the volumes hosted on the selected node. The color represents the amount of throttling:
-
Green: The node is not being throttled. Volumes are permitted to perform up to their maximum configured IOPs.
-
Yellow: The node is experiencing limited throttling. Volumes are throttled down from their maximum IOPs setting, but still retain performance at or above their minimum IOPS setting.
-
Red: The node is experiencing high throttling. When volumes are throttled more severely, performance can fall below the minimum IOPs setting.
The Total Volume Throughput graph displays the sum of the throughput for the primary volumes for a selected node. The graph shows the sum of volume read and write throughput. It does not include metadata or other node traffic. It also takes into account when volumes are present on a node, which results in a drop in throughput when volumes are transferred off a node.
Expand the graph example
Position the mouse pointer at any point in the graph to see point-in-time details.

|
From the Node Throttling page, you can determine if there is QoS pushback in a storage cluster, see this KB article for information. |
Export node throttling data
You can export graph data to a comma-separated values (CSV) format. Only the information displayed in the graph is exported.
-
In a list view or graph, select the
 icon.
icon.