Monitor S3 and Swift client operations
 Suggest changes
You can monitor object ingest and retrieval rates as well as metrics for object counts, queries, and verification. You can view the number of successful and failed attempts by client applications to read, write, and modify objects in the StorageGRID system.
-
You are signed in to the Grid Manager using a supported web browser.
-
From the dashboard, select the Performance tab.
-
Refer to the S3 and Swift charts, which summarize the number of client operations performed by Storage Nodes and the number of API requests received by Storage Nodes during the selected time frame.
-
Select NODES to access the Nodes page.
-
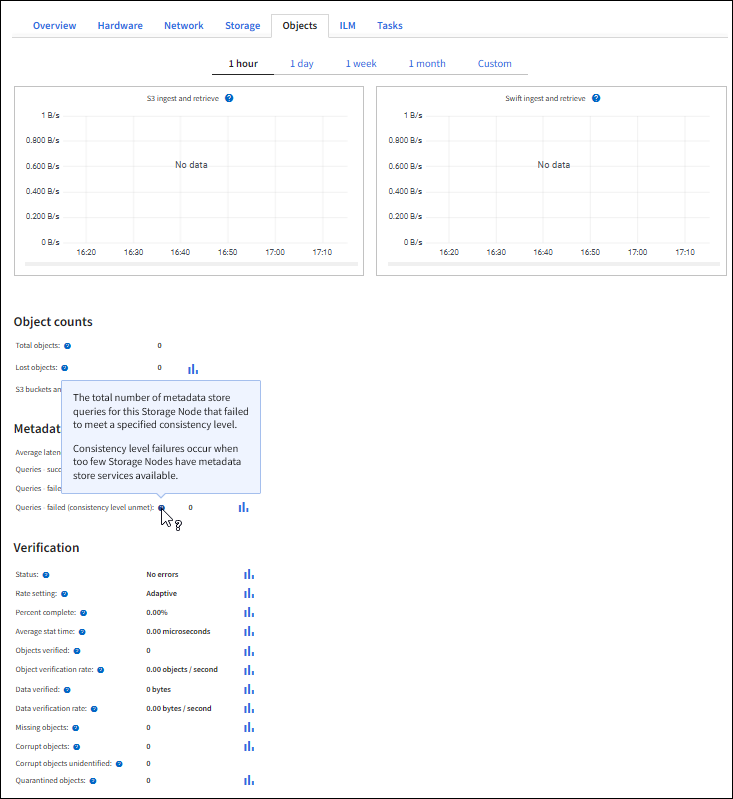
From the Nodes home page (grid level), select the Objects tab.
The chart shows S3 and Swift ingest and retrieve rates for your entire StorageGRID system in bytes per second and the amount of data ingested or retrieved. You can select a time interval or apply a custom interval.
-
To see information for a particular Storage Node, select the node from the list on the left, and select the Objects tab.
The chart shows the ingest and retrieve rates for the node. The tab also includes metrics for object counts, metadata queries, and verification operations.