
Advanced monitoring in StorageGRID
 Suggest changes
Learn how to access and export metrics to help troubleshoot issues.
View metrics API through a Prometheus query
Prometheus is an open-source software for collecting metrics. To access StorageGRID’s embedded Prometheus through the GMI, go to .
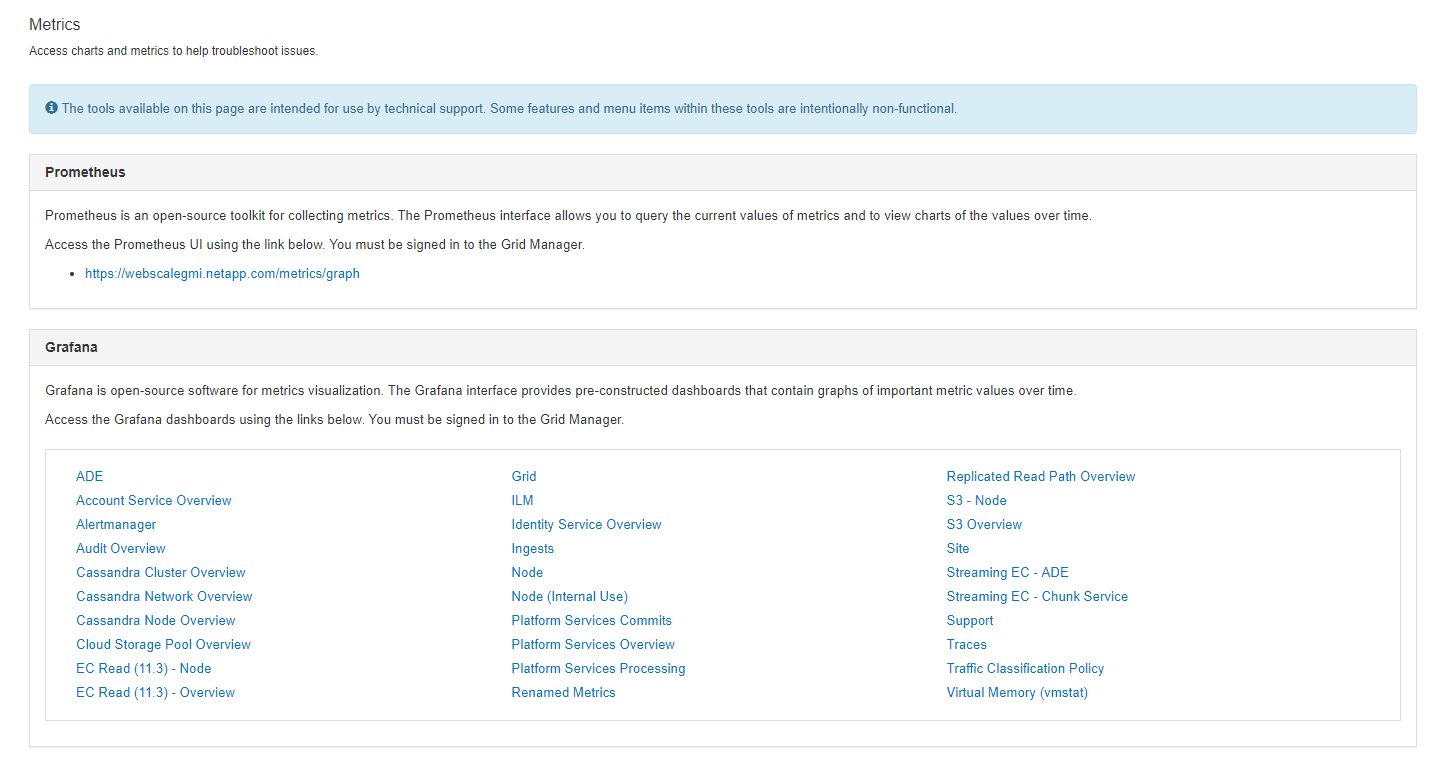
Alternatively, you can navigate to the link directly.
With this view, you can access the Prometheus interface. From there, you can search through available metrics and even experiment with queries.
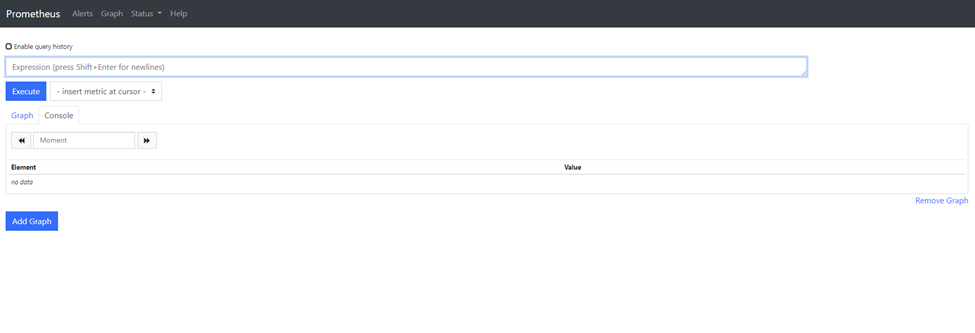
To make a Prometheus URL query, follow these steps:
-
Start typing in the query text box. As you type, metrics are listed. For our purposes, only metrics that start with StorageGRID and Node are important.
-
To see the number of HTTP sessions for each node, type
storagegrid_httpand selectstoragegrid_http_sessions_incoming_currently_established. Click Execute and display the information in a graph or console format.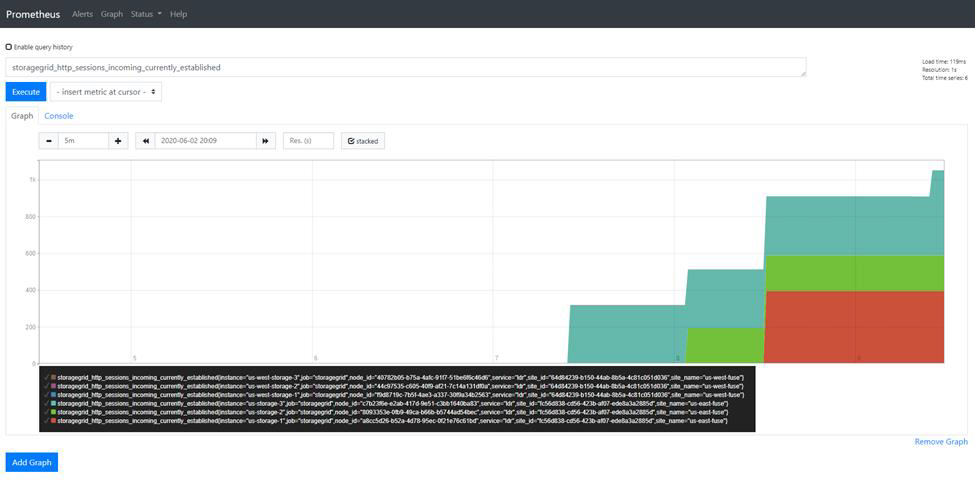

|
Queries and charts that you build through this URL do not persist. Complex queries consume resources on the admin node. NetApp recommends that you use this view to explore available metrics. |
|
|
It is not recommended to directly interface to our Prometheus instance because this requires opening additional ports. Accessing metrics through our API is the recommended and secure method. |
Export metrics through the API
You can also access the same data through the StorageGRID management API.
To export metrics through the API, follow these steps:
-
From the GMI, select .
-
Scroll down to Metrics and select GET /grid/metric-query.
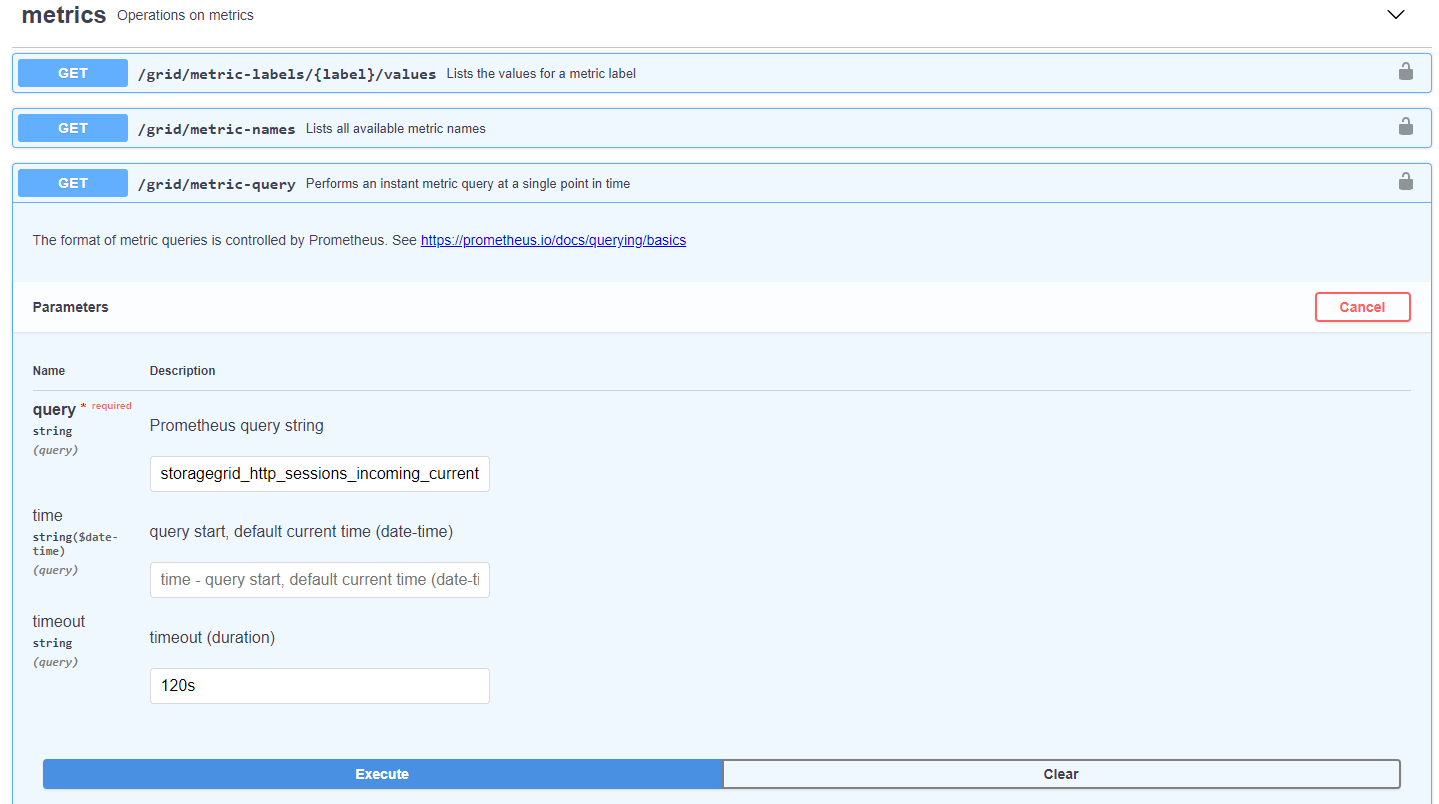
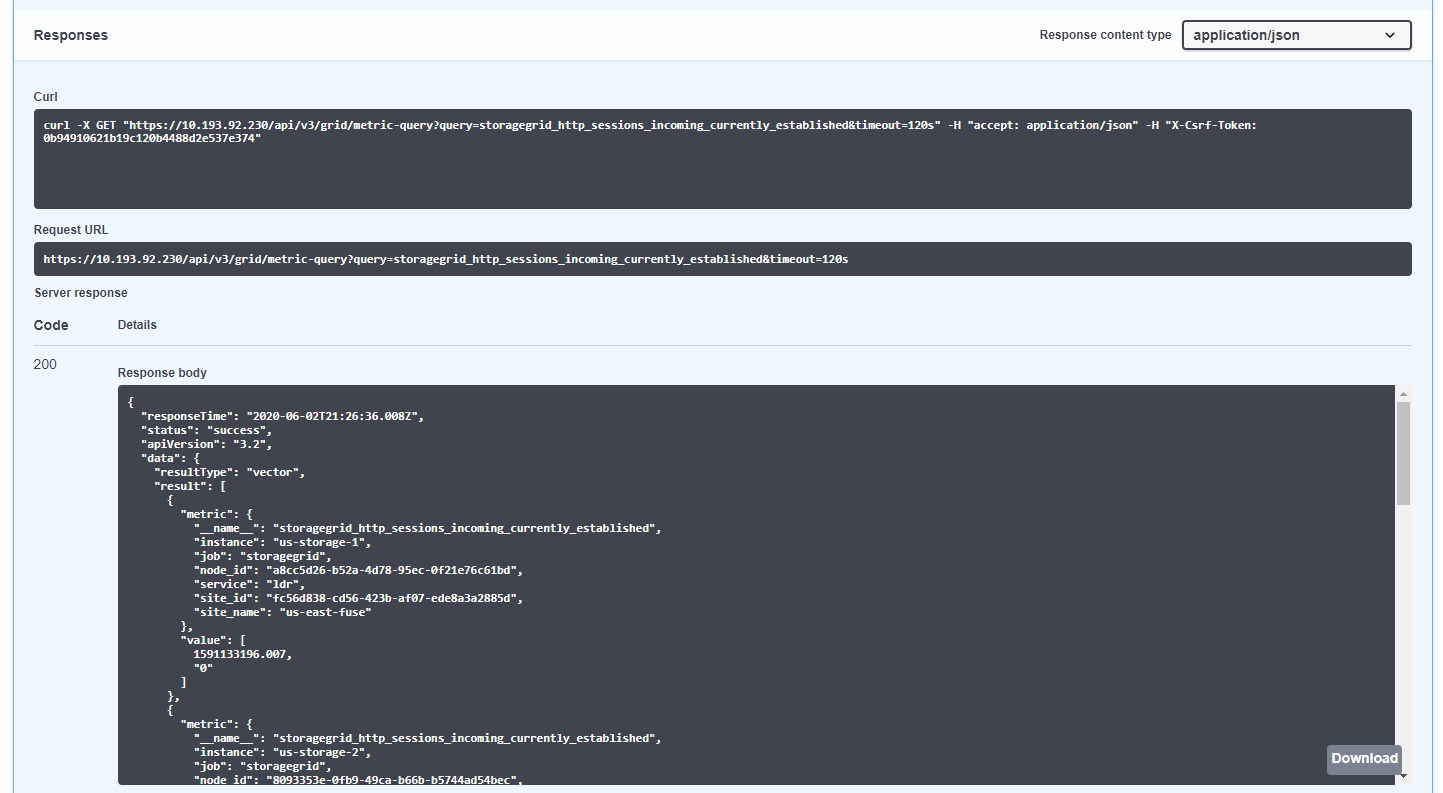
The response includes the same information that you can obtain through a Prometheus URL query. You can again see the number of HTTP sessions that are currently established on each storage node. You can also download the response in JSON format for readability. The following figure shows sample Prometheus query responses.
|
|
The advantage of using the API is that it enables you to perform authenticated queries |