View metrics using the Grafana dashboard in StorageGRID
Contributors

 Suggest changes
Learn how to use the Grafana interface to visualize and monitor your StorageGRID data.
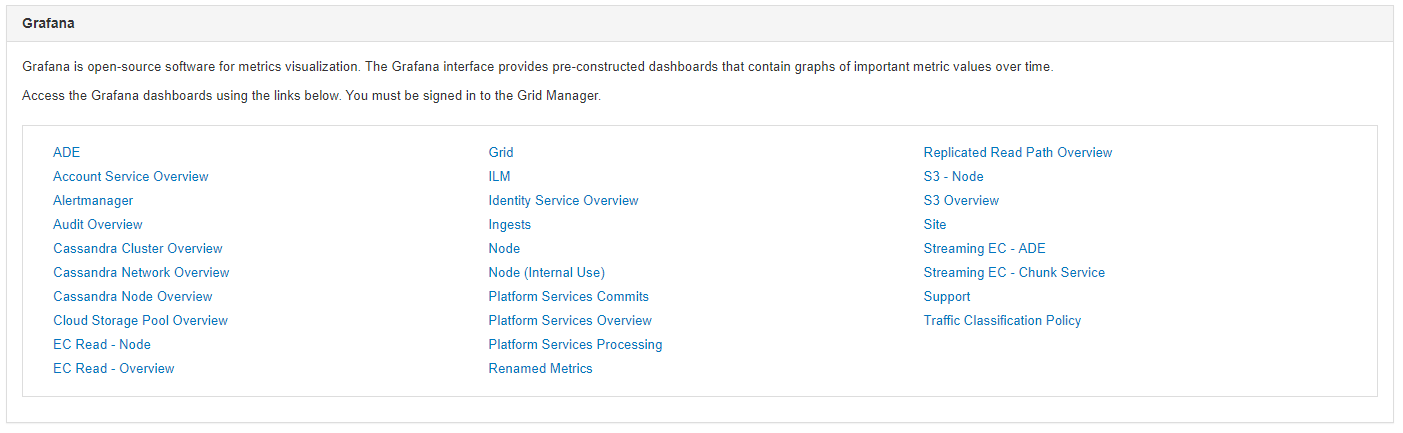
Grafana is an open-source software for metric visualization. By default, we have preconstructed dashboards that provide useful and powerful information regarding your StorageGRID system.
These preconstructed dashboards are not only useful for monitoring but also for troubleshooting an issue. Some are intended for use by technical support. For example, to view the metrics of a storage node, follow these steps.
Steps
-
From the GMI, .
-
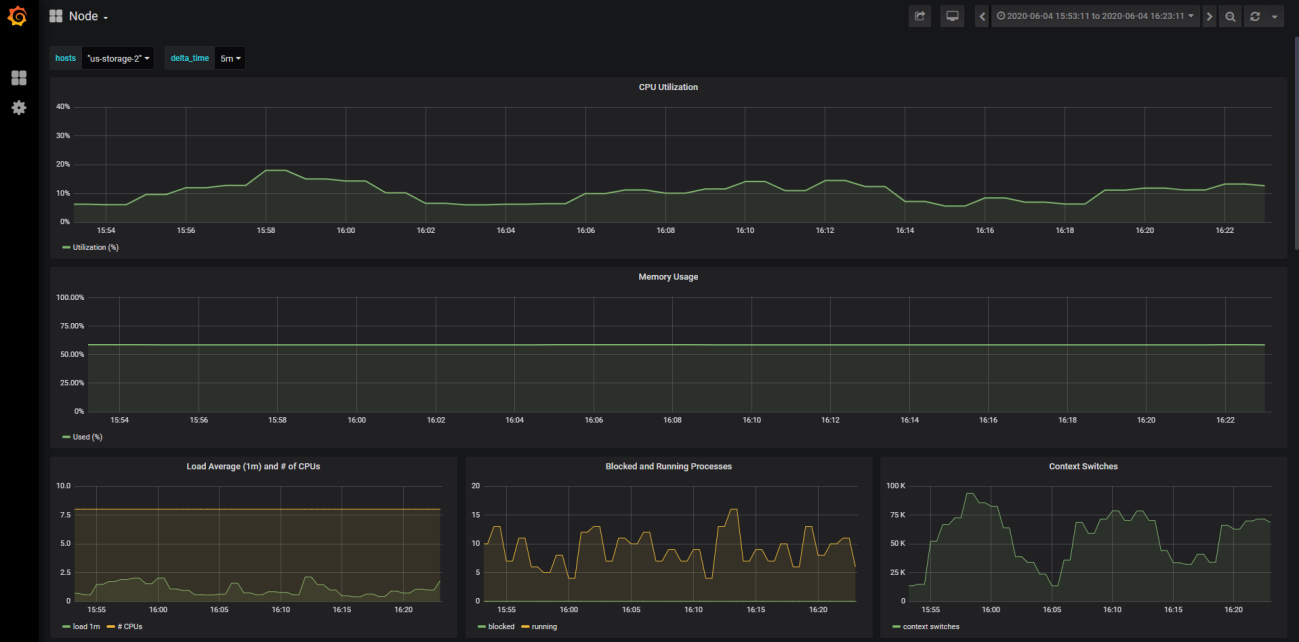
Under the Grafana section, select the Node dashboard.
-
In Grafana, set the hosts to whichever node you want to view metrics on. In this case, a storage node is selected. More information is provided than the following screenshot captures.