

StorageGRID log analytics using ELK stack
 Suggest changes
By Angela Cheng
With the StorageGRID syslog forward feature, you can configure an external syslog server to collect and analyze StorageGRID log messages. ELK (Elasticsearch, Logstash, Kibana) has become one of the most popular log analytics solutions. Watch the StorageGRID log analysis using ELK video to view a sample ELK configuration and how it can be used to identify and troubleshoot failed S3 requests.
StorageGRID 11.9 supports exporting load balancer endpoint access log to external syslog server. Watch this Youtube Video to learn more about this new feature.
This article provides sample files of Logstash configuration, Kibana queries, charts and dashboard to give you a quick start for StorageGRID log management and analytics.
Requirements
-
StorageGRID 11.6.0.2 or higher
-
ELK (Elasticsearch, Logstash and Kibana) 7.1x or higher installed and in operation
Sample files
-
Download the Logstash 7.x sample files package
md5 checksum 148c23d0021d9a4bb4a6c0287464deab
sha256 checksum f51ec9e2e3f842d5a7861566b167a561beb4373038b4e7bb3c8be3d522adf2d6 -
Download the Logstash 8.x sample files package
md5 checksum e11bae3a662f87c310ef363d0fe06835
sha256 checksum 5c670755742cfdfd5aa723a596ba087e0153a65bcaef3934afdb682f61cd278d -
Download the Logstash 8.x sample files package for StorageGRID 11.9
md5 checksum 41272857c4a54600f95995f6ed74800d
sha256 checksum 67048ee8661052719990851e1ad960d4902fe537a6e135e8600177188da677c9
Assumption
Readers are familiar with StorageGRID and ELK terminology and operations.
Instruction
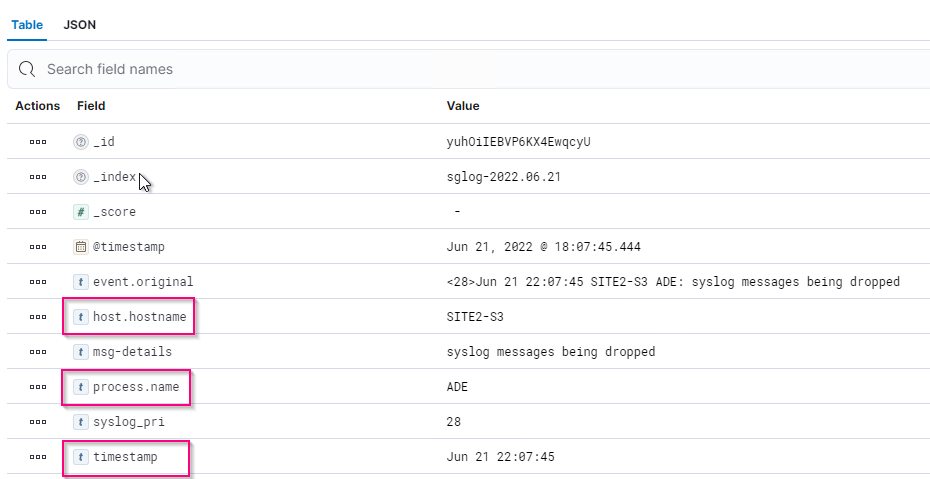
Two sample versions are provided due to differences in names defined by grok patterns.
For example, the SYSLOGBASE grok pattern in Logstash config file defines field names differently depending on the installed Logstash version.
match => {"message" => '<%{POSINT:syslog_pri}>%{SYSLOGBASE} %{GREEDYDATA:msg-details}'}
Logstash 7.17 sample
Logstash 8.23 sample
Steps
-
Unzip the provided sample based on your installed ELK version.
The sample folder includes two Logstash config samples:
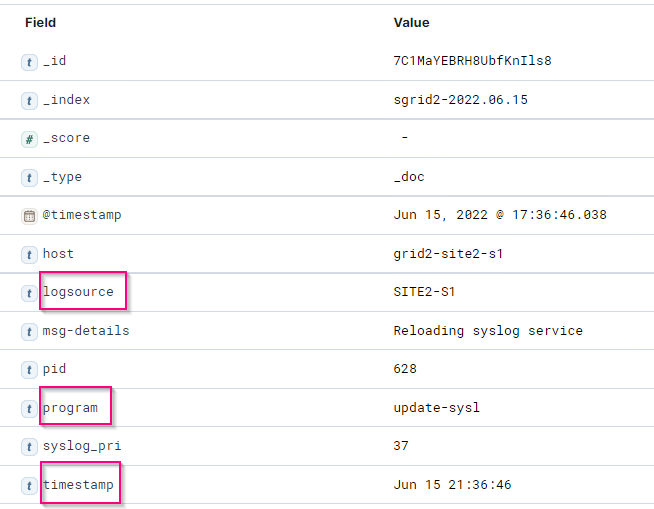
sglog-2-file.conf: this config file outputs StorageGRID log messages to a file on Logstash without data transformation. You can use this to confirm Logstash is receiveing StorageGRID messages or to help understand StorageGRID log patterns.
sglog-2-es.conf: this config file transforms StorageGRID log messages using various pattern and filters. It includes example drop statements, which drop messages based on patterns or filter. The output is sent to Elasticsearch for indexing.
Customize the selected config file according to the instruction inside the file. -
Test the customized config file:
/usr/share/logstash/bin/logstash --config.test_and_exit -f <config-file-path/file>
If the last line returned is similar to the below line, the config file has no syntax errors:
[LogStash::Runner] runner - Using config.test_and_exit mode. Config Validation Result: OK. Exiting Logstash
-
Copy the customized conf file to the Logstash server's config: /etc/logstash/conf.d
If you have not enabled config.reload.automatic in /etc/logstash/logstash.yml, restart the Logstash service. Otherwise, wait for the config reload interval to elapse.grep reload /etc/logstash/logstash.yml # Periodically check if the configuration has changed and reload the pipeline config.reload.automatic: true config.reload.interval: 5s
-
Check /var/log/logstash/logstash-plain.log and confirm there are no errors starting Logstash with the new config file.
-
Confirm TCP port is started and listening.
In this example, TCP port 5000 is used.netstat -ntpa | grep 5000 tcp6 0 0 :::5000 :::* LISTEN 25744/java
-
From the StorageGRID manager GUI, configure external syslog server to send log messages to Logstash. Refer to the demo video for details.
-
You need to configure or disable firewall on the Logstash server to allow StorageGRID nodes connection to the defined TCP port.
-
From Kibana GUI, select Management → Dev Tools. On the Console page, run this GET command to confirm new indices are created on Elasticsearch.
GET /_cat/indices/*?v=true&s=index
-
From Kibana GUI, create index pattern (ELK 7.x) or data view (ELK 8.x).
-
From Kibana GUI, enter 'saved objects' in the search box which is located in the top center.
On the Saved Objects page, select Import. Under Import options, select 'Request action on conflict'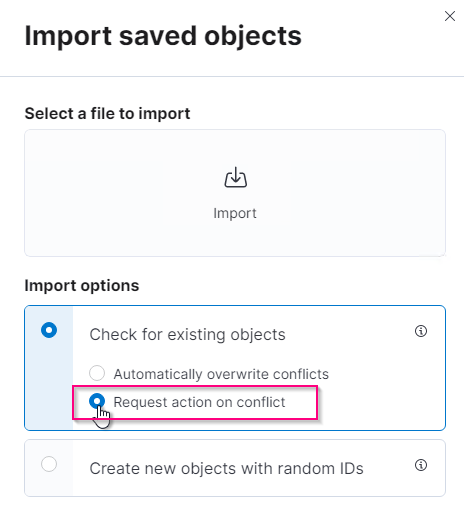
Import elk<version>-query-chart-sample.ndjson.
When prompted to resolve the conflict, select the index pattern or data view you created in step 8.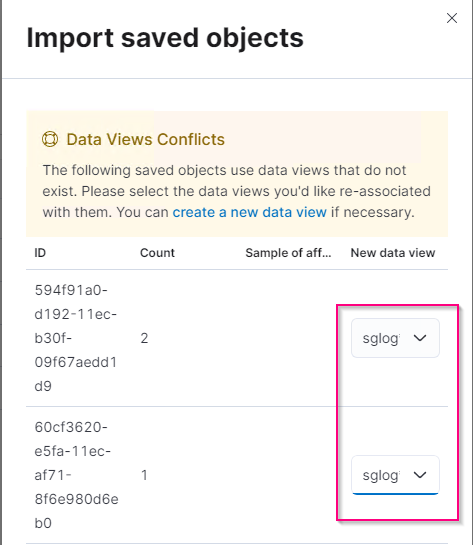
The following Kibana objects are imported:
Query
* audit-msg-s3rq-orlm
* bycast log s3 related messages
* loglevel warning or above
* failed security event
* nginx-gw endpoint access log (available only in elk8-sample-for-sg119.zip)
Chart
* s3 requests count based on bycast.log
* HTTP status code
* audit msg breakdown by type
* average s3 response time
Dashboard
* S3 request dashboard using the above charts.
You are now ready to perform StorageGRID log analysis using Kibana.