Run a scan
 Suggest changes
When the NFS/SMB files system is added to the XCP File Analytics GUI, you can start a file system scan to analyze and represent the data.
-
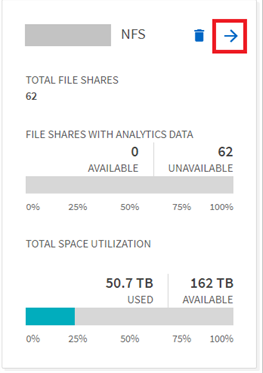
Select the arrow on the added file server card to view the file shares on the file server.
-
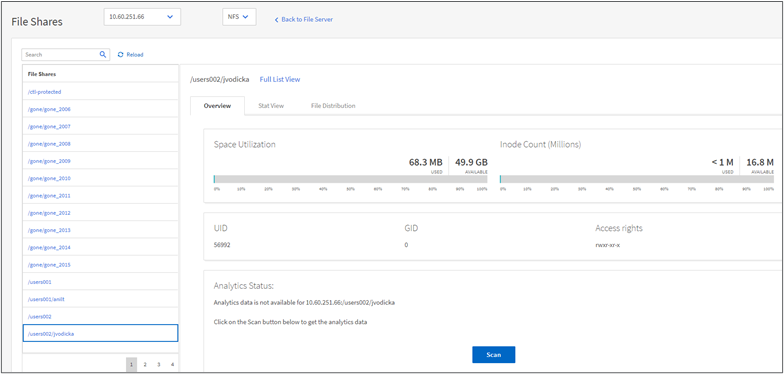
From the list of file shares, select the name of the file share to scan.
-
Select Scan to start the scan.
XCP displays a progress bar for the scan.
-
When the scan is complete the stat view and file distribution tabs are enabled to allow you to view graphs.
Learn about graphs
The File Analytics GUI dashboard displays multiple graphs for visualizing File Analytics.
Hot Cold Count Graph
XCP File Analytics categorizes files not accessed for 90 days as cold data. Files accessed in the last 90 days are hot data. Criteria to define hot and cold data is based on access time only.
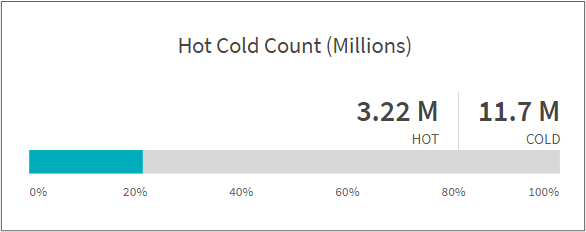
The Hot Cold Count graph displays the number of inodes (in millions) that are hot or cold in XCP NFS. In XCP SMB, this graph denotes the number of files that are hot or cold.
The colored bar represents the hot data and shows the percentage of files accessed within 90 days.
Hot Cold Size Graph
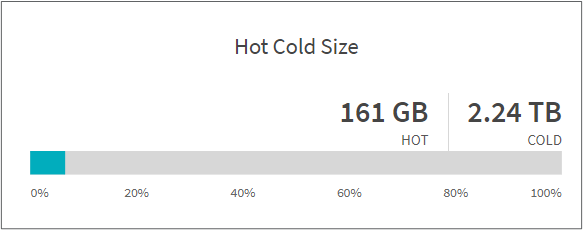
The Hot Cold Size graph displays the percentage of files that are hot and cold and the total size of the files in each category. The colored bar represents the hot data and the uncolored part represents the cold data. Criteria to define hot and cold data is based on access time only.
Entries in Directory Graph
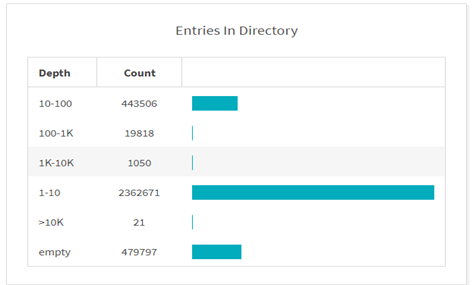
The Entries in Directories graph displays the number of entries in directories. The Depth column contains different directory sizes and the Count column indicates the number of entries in each directory depth.
File Distribution by Size Graph
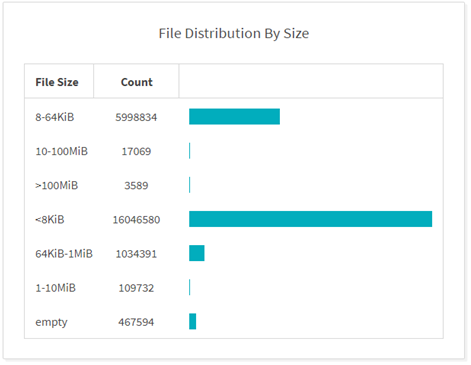
The File Distribution by Size graph displays the number of files that are under the given file sizes. The File Size column contains the categories of file size and the Count column indicates the distribution of the number of files.
Directory Depth Graph
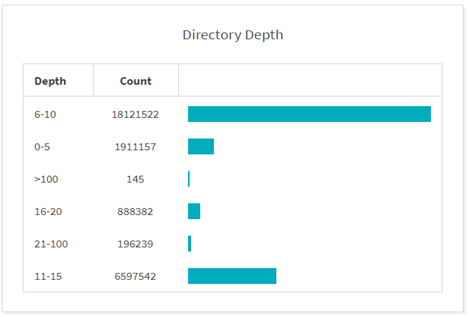
The Directory Depth graph represents the distribution of the number of directories in various directory depth ranges. The Depth column contains various directory depths and the Count column contains the count of each directory depth in the file share.
File Space Used by Size Graph
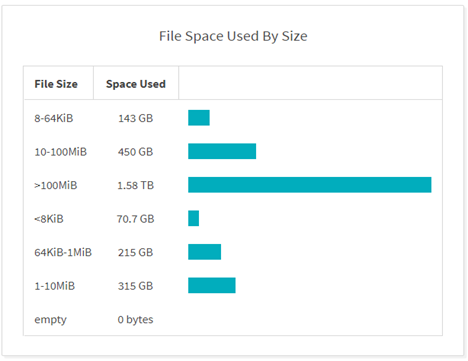
The File Space Used by Size graph displays the number of files in different file-size ranges. The File Size column contains different file size ranges and the Space Used column indicates the space used by each file size range.
Space Occupied by Users Graph
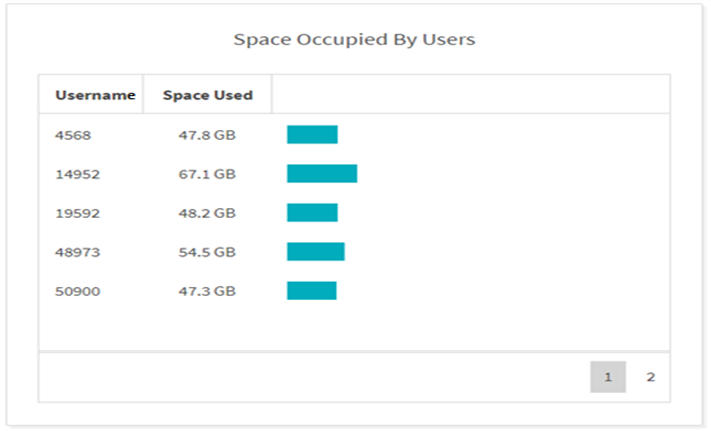
The Space Occupied by Users graph displays the space used by users. The Username column contains the names of users (UID when usernames cannot be retrieved) and the Space Used column indicates the space used by each username.
Files Accessed/Modified/Created Graph
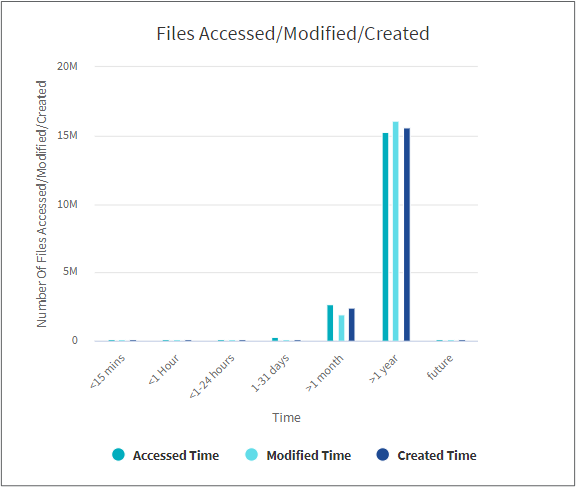
The Files Accessed/Modified/Created graph displays the count of files changed over time. The X-axis represents the period of time within which changes were made and the Y-axis represents the number of files changed.

|
To get the access time (atime) graph in SMB scans, check the box for preserving atime before running a scan. |
File Size Accessed/Modified/Created Graph
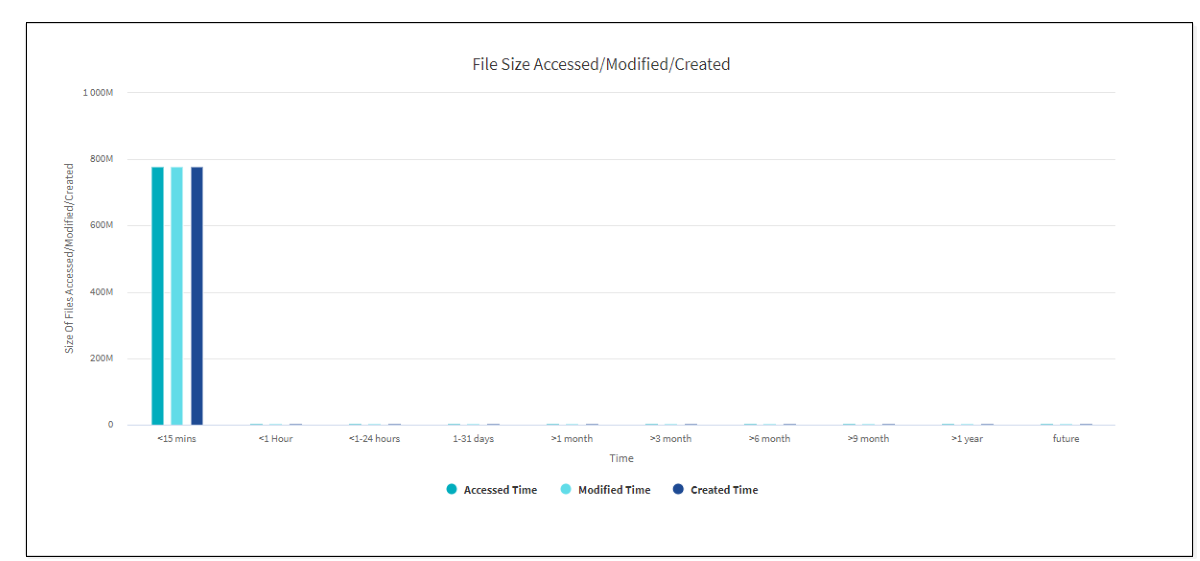
The File Size Accessed/Modified/Created graph displays the size of files changed over time. The X-axis represents the period of time within which changes were made and the Y- axis represents the size of files changed.
|
|
To get the access time (atime) graph in SMB scans, check the box for preserving atime before running a scan. |
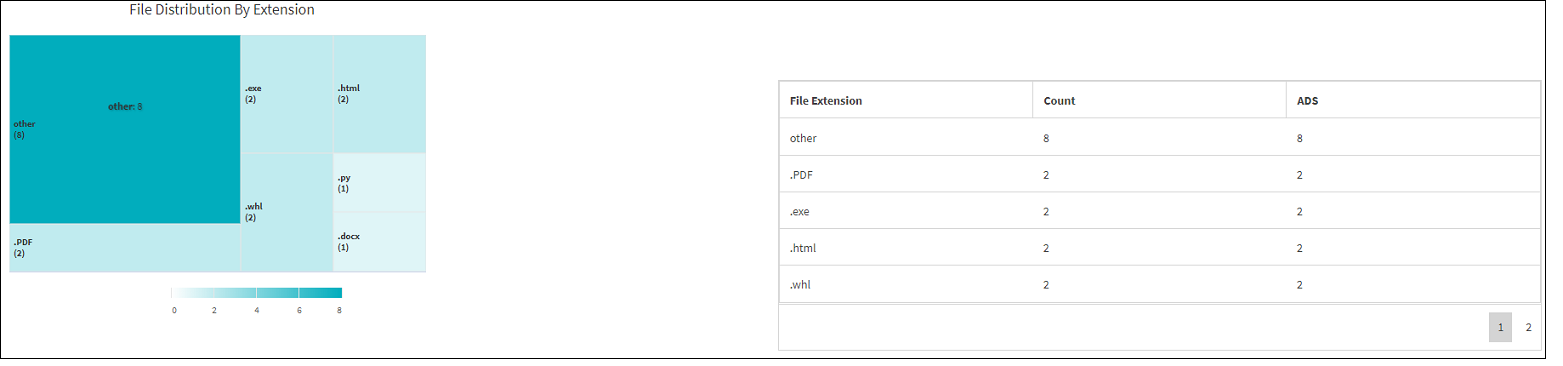
File Distribution by Extension Graph
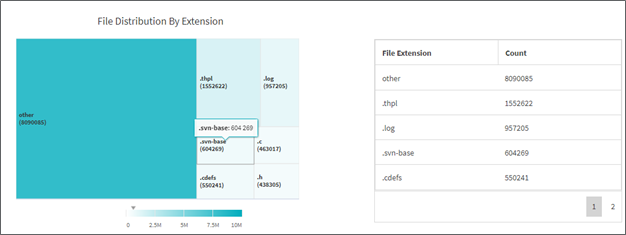
The File Distribution by Extension graph represents the count of the different file extensions in a file share. The size of the divisions representing the extensions is based on the number of files with each extension.
Additionally, for SMB shares, you can get the number of alternate data streams files for each file extension by checking the box for alternate data streams before running a scan.
File Size Distribution by Extension Graph
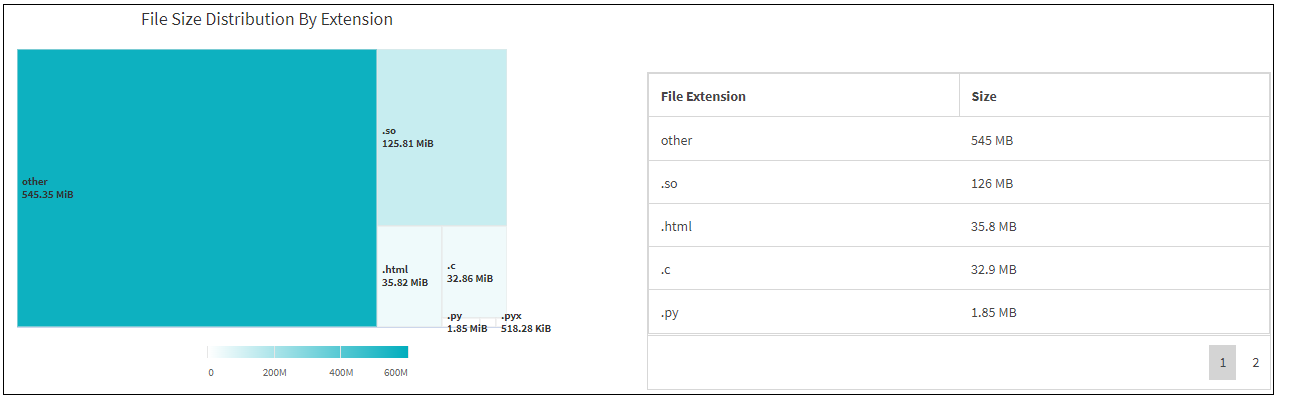
The File Size Distribution by Extension graph represents the cumulative size of the different file extensions in a file share. The size of the divisions representing the extensions is based on the size of files with each extension.
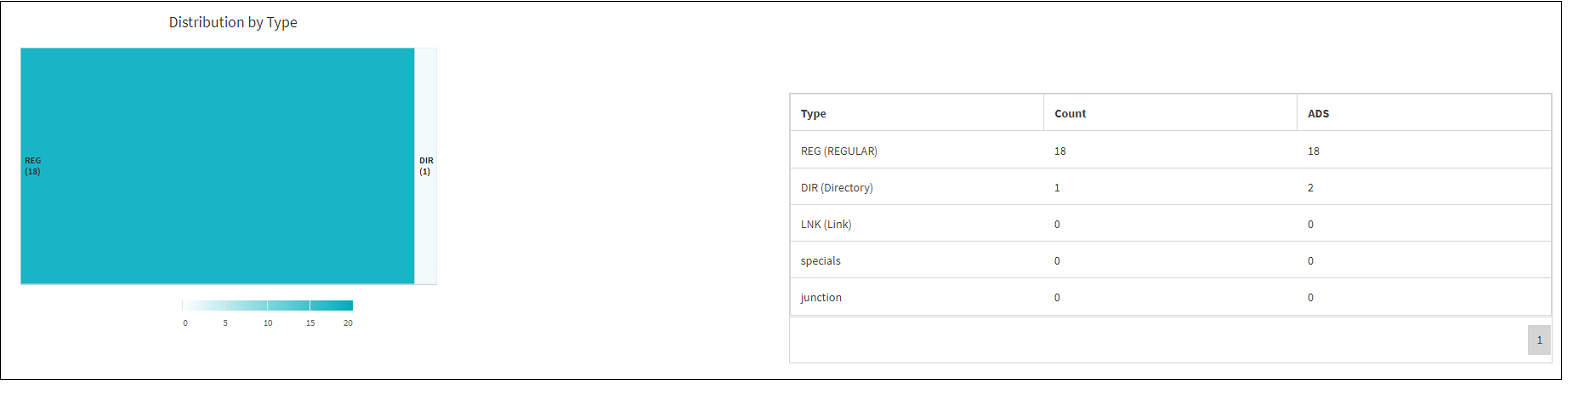
File Distribution by Type Graph
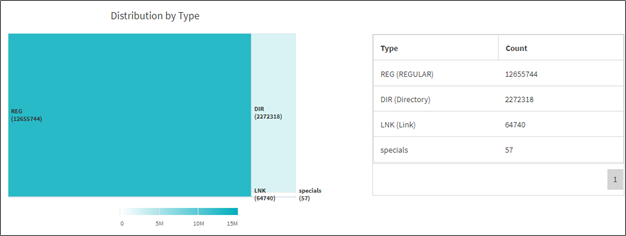
The Distribution by Type graph represents the count of the following types of files:
-
REG: Regular files
-
LNK: Files with links
-
Specials: Files with device files and character files.
-
DIR: Files with directories
-
Junction: Available in SMB only
Additionally, for SMB shares, you can get the number of alternate data streams files for different types by checking the box for alternate data streams before running a scan.