

PrometheusとGrafanaを使用して指標の保持を拡張します
 変更を提案
変更を提案
アロンクライン著
この技術レポートでは、外部の Prometheus および Grafana サービスを使用してNetApp StorageGRID を構成するための詳細な手順を説明します。
はじめに
StorageGRID は、Prometheusを使用して指標を保存し、組み込みのGrafanaダッシュボードでこれらの指標を視覚化します。Prometheus指標には、クライアントアクセス証明書を設定し、指定されたクライアントのPrometheusアクセスを有効にすることで、StorageGRID から安全にアクセスできます。現在、この指標データの保持期間は管理ノードのストレージ容量によって制限されています。これらの指標のカスタマイズされた可視化を実現するために、新しいPrometheusサーバとGrafanaサーバを導入し、新しいサーバでStorageGRIDWebscaleインスタンスから指標をスクラビングするように設定し、重要な指標を使用したダッシュボードを構築します。で収集されたPrometheus指標の詳細を確認できます "StorageGRID のドキュメント"。
Prometheusをフェデレーションする
ラボの詳細
この例では、StorageGRID 11.6ノードとDebian 11サーバのすべての仮想マシンを使用します。StorageGRID 管理インターフェイスには、公開されている信頼されたCA証明書が設定されています。この例では、StorageGRID システムやDebian Linuxのインストールと設定は行われません。PrometheusとGrafanaでサポートされている、任意のLinuxフレーバーを使用できます。PrometheusとGrafanaはどちらも、Dockerコンテナ、ソースからビルド、またはコンパイル済みのバイナリとしてインストールできます。この例では、PrometheusバイナリとGrafanaバイナリの両方を同じDebianサーバに直接インストールします。から基本的なインストール手順をダウンロードして実行します https://prometheus.io および https://grafana.com/grafana/ それぞれ。
Prometheusクライアントアクセス用にStorageGRID を設定する
StorageGRID IDに格納されているPrometheus指標にアクセスするには、秘密鍵を使用してクライアント証明書を生成またはアップロードし、クライアントの権限を有効にする必要があります。StorageGRID 管理インターフェイスにはSSL証明書が必要です。この証明書は、信頼されたCAによってPrometheusサーバによって信頼されているか、自己署名されている場合は手動で信頼されている必要があります。詳細については、を参照してください "StorageGRID のドキュメント"。
-
StorageGRID 管理インターフェイスの左下にある「configuration」を選択し、2番目の列にある「Security」で「Certificates」をクリックします。
-
[証明書]ページで[クライアント]タブを選択し、[追加]ボタンをクリックします。
-
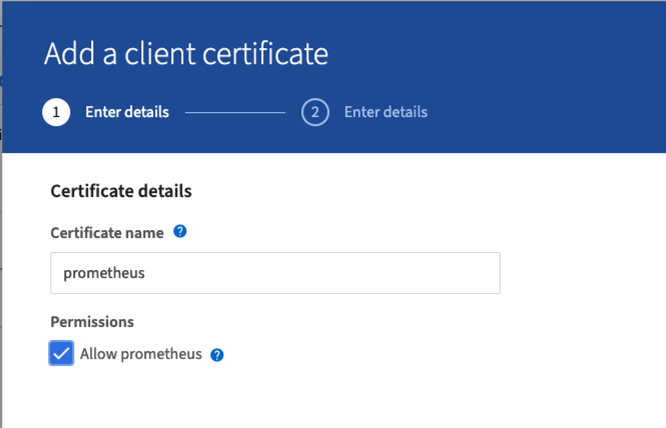
アクセスを許可するクライアントの名前を指定し、この証明書を使用します。「Allow Prometheus」の前の「Permissions」のボックスをクリックし、「Continue」ボタンをクリックします。
-
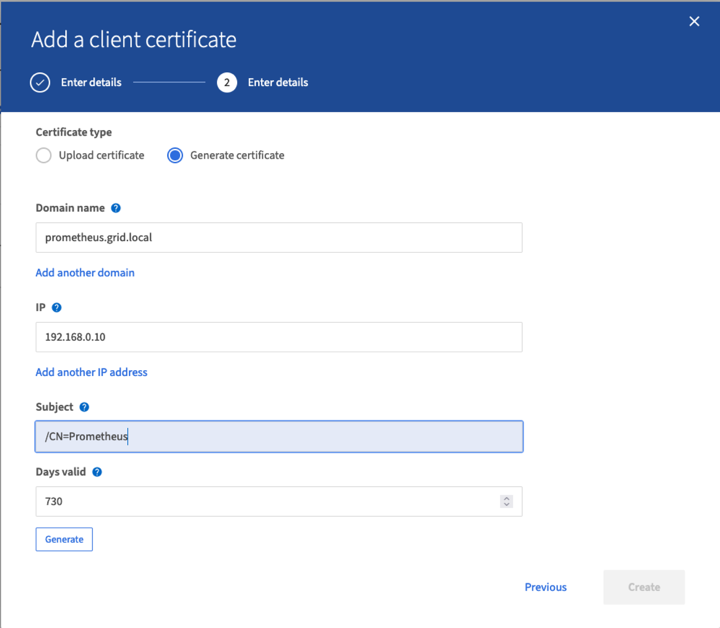
CA署名証明書がある場合は、[証明書のアップロード]のラジオボタンを選択できますが、この場合は、[証明書の生成]のラジオボタンを選択して、StorageGRID がクライアント証明書を生成できるようにします。入力する必須フィールドが表示されます。クライアントサーバのFQDN、サーバのIP、件名、有効日数を入力します。「生成」ボタンをクリックします。

|
Be mindful of the certificate days valid entry as you will need to renew this certificate in both StorageGRID and the Prometheus server before it expires to maintain uninterrupted collection. |
-
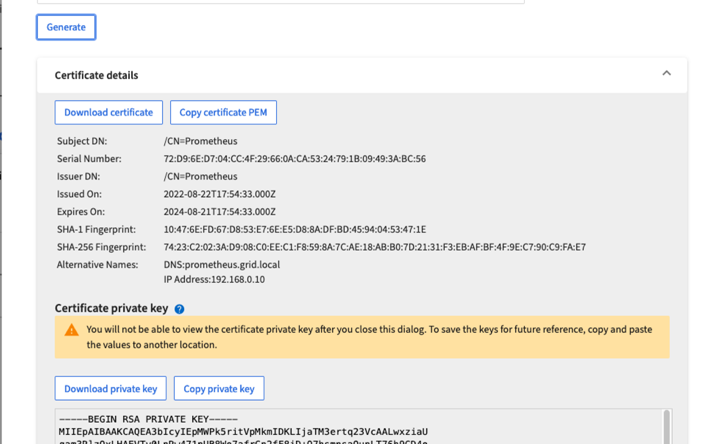
証明書のPEMファイルと秘密鍵のPEMファイルをダウンロードします。
|
|
This is the only time you can download the private key, so make sure you do not skip this step. |
LinuxサーバでPrometheusインストールを準備
Prometheusをインストールする前に、Prometheusユーザとディレクトリ構造を使用して環境を準備し、指標の格納場所の容量を設定します。
-
Prometheusユーザを作成します。
sudo useradd -M -r -s /bin/false Prometheus -
Prometheus、クライアント証明書、指標データのディレクトリを作成します。
sudo mkdir /etc/Prometheus /etc/Prometheus/cert /var/lib/Prometheus -
私はext4ファイルシステムでのメトリック保持のために使用するディスクをフォーマットしました。
mkfs -t ext4 /dev/sdb
-
そのあと、Prometheusのmetricsディレクトリにファイルシステムをマウントしました。
sudo mount -t auto /dev/sdb /var/lib/prometheus/
-
指標データに使用するディスクのUUIDを取得します。
sudo ls -al /dev/disk/by-uuid/
   lrwxrwxrwx 1 root root   9 Aug 18 17:02 9af2c5a3-bfc2-4ec1-85d9-ebab850bb4a1 -> ../../sdb
-
/etc/fstabにエントリを追加してマウントをリブート後も/dev/sdbのUUIDを使用して維持するようにします。
/etc/fstab
UUID=9af2c5a3-bfc2-4ec1-85d9-ebab850bb4a1 /var/lib/prometheus	ext4	defaults	0	0
Prometheusをインストールして設定する
これでサーバの準備ができました。Prometheusのインストールを開始して、サービスを設定できます。
-
Prometheusインストールパッケージを展開します
tar xzf prometheus-2.38.0.linux-amd64.tar.gz -
バイナリを/usr/local/binにコピーし、前の手順で作成したPrometheusユーザに所有権を変更します
sudo cp prometheus-2.38.0.linux-amd64/{prometheus,promtool} /usr/local/bin sudo chown prometheus:prometheus /usr/local/bin/{prometheus,promtool} -
コンソールとライブラリを/etc/Prometheusにコピーします
sudo cp -r prometheus-2.38.0.linux-amd64/{consoles,console_libraries} /etc/prometheus/ -
以前にStorageGRID からダウンロードしたクライアント証明書と秘密鍵のPEMファイルを/etc/prometheus/certsにコピーします
-
Prometheus設定YAMLファイルを作成します
sudo nano /etc/prometheus/prometheus.yml -
次の構成を挿入します。ジョブ名には、任意の名前を指定できます。「-targets:[']]」を管理ノードのFQDNに変更し、証明書と秘密鍵のファイル名を変更した場合は、tls_configセクションを更新して一致させてください。次に、ファイルを保存します。グリッド管理インターフェイスで自己署名証明書を使用している場合は、証明書をダウンロードして一意の名前のクライアント証明書に格納し、tls_configセクションadd ca_file:/etc/prometheus/cert/UIcert.pemに格納します
-
この例では、alertmanager、cassandra、node、およびStorageGRID で始まるすべての指標を収集しています。Prometheus指標の詳細については、を参照してください "StorageGRID のドキュメント"。
# my global config
global:
  scrape_interval: 60s # Set the scrape interval to every 15 seconds. Default is every 1 minute.

scrape_configs:
  - job_name: 'StorageGRID'
    honor_labels: true
    scheme: https
    metrics_path: /federate
    scrape_interval: 60s
    scrape_timeout: 30s
    tls_config:
      cert_file: /etc/prometheus/cert/certificate.pem
      key_file: /etc/prometheus/cert/private_key.pem
    params:
      match[]:
        - '{__name__=~"alertmanager_.*|cassandra_.*|node_.*|storagegrid_.*"}'
    static_configs:
    - targets: ['sgdemo-rtp.netapp.com:9091']
-
|
|
グリッド管理インターフェイスで自己署名証明書が使用されている場合は、証明書をダウンロードして一意の名前でクライアント証明書に格納します。tls_configセクションで、クライアント証明書と秘密鍵の行の上に証明書を追加します ca_file: /etc/prometheus/cert/UIcert.pem |
-
Prometheus内のすべてのファイルとディレクトリの所有権と、/var/lib/prometPrometheusユーザへの所有権を変更する
sudo chown -R prometheus:prometheus /etc/prometheus/ sudo chown -R prometheus:prometheus /var/lib/prometheus/ -
/etc/systemd/systemにPrometheusサービスファイルを作成します
sudo nano /etc/systemd/system/prometheus.service -
次の行を挿入します。--storage.tsd.dretention.time=1y#というメトリックデータの保持期間を1年に設定します。また、ストレージの制限に基づいて保持期間を設定する場合も、--storage.tsdb.retentionsize=300GiB#を使用することもできます。指標の保持を設定できるのは、この場所だけです。
[Unit] Description=Prometheus Time Series Collection and Processing Server Wants=network-online.target After=network-online.target [Service] User=prometheus Group=prometheus Type=simple ExecStart=/usr/local/bin/prometheus \ --config.file /etc/prometheus/prometheus.yml \ --storage.tsdb.path /var/lib/prometheus/ \ --storage.tsdb.retention.time=1y \ --web.console.templates=/etc/prometheus/consoles \ --web.console.libraries=/etc/prometheus/console_libraries [Install] WantedBy=multi-user.target -
システムdサービスをリロードして新しいPrometheusサービスを登録します。その後、Prometheusサービスを開始して有効にします。
sudo systemctl daemon-reload sudo systemctl start prometheus sudo systemctl enable prometheus -
サービスが正常に実行されていることを確認します
sudo systemctl status prometheus● prometheus.service - Prometheus Time Series Collection and Processing Server Loaded: loaded (/etc/systemd/system/prometheus.service; enabled; vendor preset: enabled) Active: active (running) since Mon 2022-08-22 15:14:24 EDT; 2s ago Main PID: 6498 (prometheus) Tasks: 13 (limit: 28818) Memory: 107.7M CPU: 1.143s CGroup: /system.slice/prometheus.service └─6498 /usr/local/bin/prometheus --config.file /etc/prometheus/prometheus.yml --storage.tsdb.path /var/lib/prometheus/ --web.console.templates=/etc/prometheus/consoles --web.con> Aug 22 15:14:24 aj-deb-prom01 prometheus[6498]: ts=2022-08-22T19:14:24.510Z caller=head.go:544 level=info component=tsdb msg="Replaying WAL, this may take a while" Aug 22 15:14:24 aj-deb-prom01 prometheus[6498]: ts=2022-08-22T19:14:24.816Z caller=head.go:615 level=info component=tsdb msg="WAL segment loaded" segment=0 maxSegment=1 Aug 22 15:14:24 aj-deb-prom01 prometheus[6498]: ts=2022-08-22T19:14:24.816Z caller=head.go:615 level=info component=tsdb msg="WAL segment loaded" segment=1 maxSegment=1 Aug 22 15:14:24 aj-deb-prom01 prometheus[6498]: ts=2022-08-22T19:14:24.816Z caller=head.go:621 level=info component=tsdb msg="WAL replay completed" checkpoint_replay_duration=55.57µs wal_rep> Aug 22 15:14:24 aj-deb-prom01 prometheus[6498]: ts=2022-08-22T19:14:24.831Z caller=main.go:997 level=info fs_type=EXT4_SUPER_MAGIC Aug 22 15:14:24 aj-deb-prom01 prometheus[6498]: ts=2022-08-22T19:14:24.831Z caller=main.go:1000 level=info msg="TSDB started" Aug 22 15:14:24 aj-deb-prom01 prometheus[6498]: ts=2022-08-22T19:14:24.831Z caller=main.go:1181 level=info msg="Loading configuration file" filename=/etc/prometheus/prometheus.yml Aug 22 15:14:24 aj-deb-prom01 prometheus[6498]: ts=2022-08-22T19:14:24.832Z caller=main.go:1218 level=info msg="Completed loading of configuration file" filename=/etc/prometheus/prometheus.y> Aug 22 15:14:24 aj-deb-prom01 prometheus[6498]: ts=2022-08-22T19:14:24.832Z caller=main.go:961 level=info msg="Server is ready to receive web requests." Aug 22 15:14:24 aj-deb-prom01 prometheus[6498]: ts=2022-08-22T19:14:24.832Z caller=manager.go:941 level=info component="rule manager" msg="Starting rule manager..." -
PrometheusサーバのUIにアクセスできるようになります http://Prometheus-server:9090 およびUIを参照してください
-
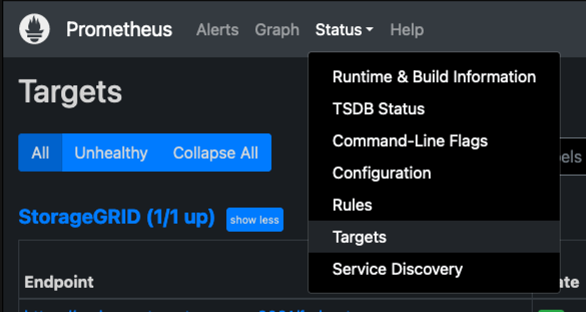
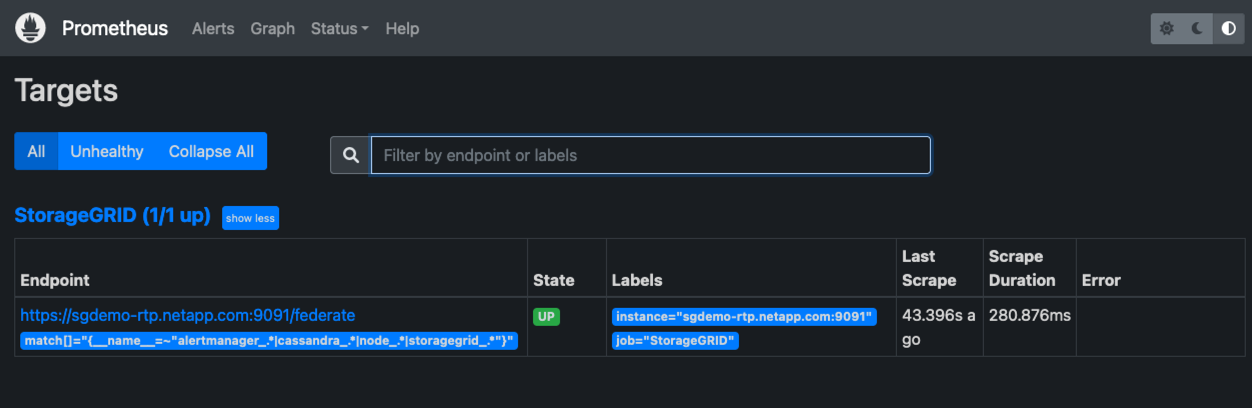
「Status」ターゲットのPrometheusで設定したStorageGRID エンドポイントのステータスを確認できます
-
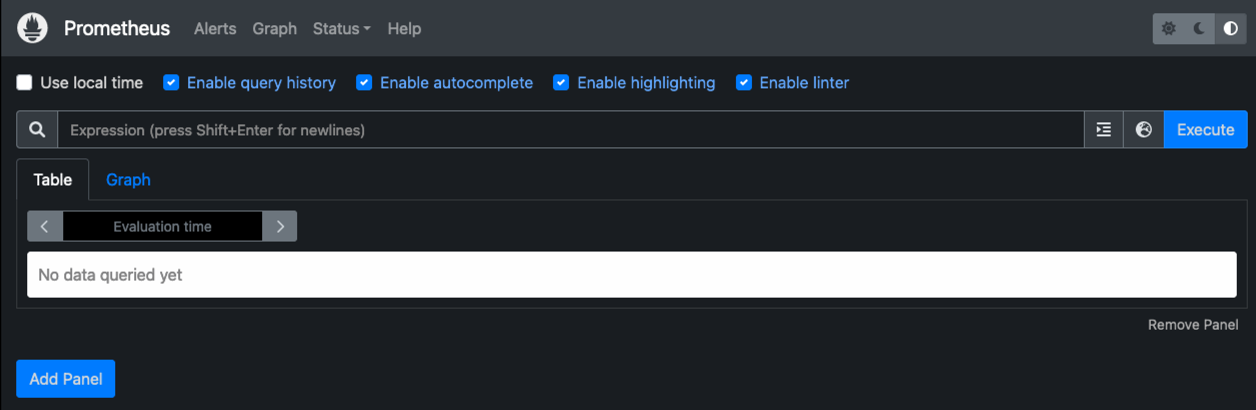
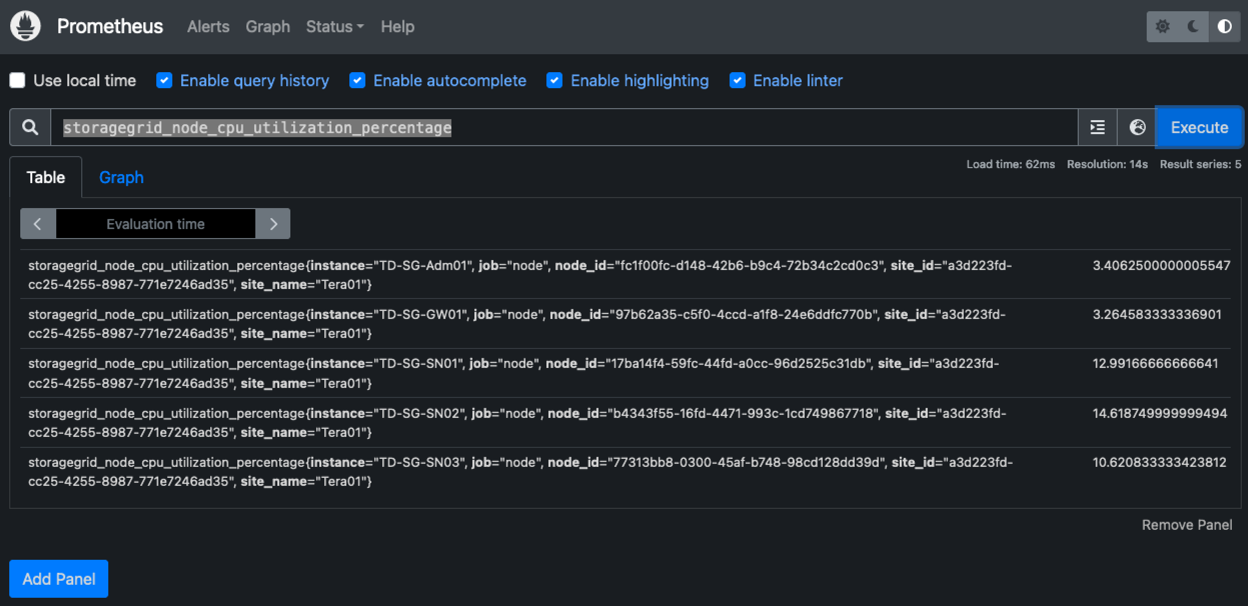
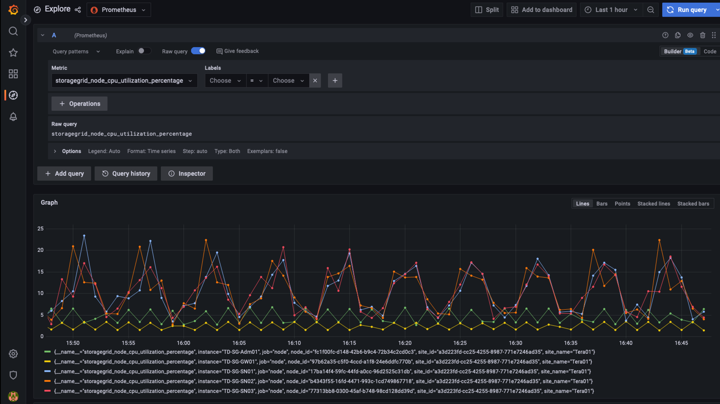
[グラフ]ページで、テストクエリを実行し、データが正常にスクレイピングされていることを確認できます。たとえば、クエリバーに「storagegrid_node_name utilization _percentage」と入力し、実行ボタンをクリックします。
Grafanaをインストールして設定します
Prometheusがインストールされて機能したので、Grafanaのインストールとダッシュボードの設定に進みます
Grafanaの分析
-
Grafanaの最新のエンタープライズエディションをインストールします
sudo apt-get install -y apt-transport-https sudo apt-get install -y software-properties-common wget sudo wget -q -O /usr/share/keyrings/grafana.key https://packages.grafana.com/gpg.key -
安定版リリース用に次のリポジトリを追加します。
echo "deb [signed-by=/usr/share/keyrings/grafana.key] https://packages.grafana.com/enterprise/deb stable main" | sudo tee -a /etc/apt/sources.list.d/grafana.list -
リポジトリを追加した後。
sudo apt-get update sudo apt-get install grafana-enterprise -
systemdサービスをリロードして新しいgrafanaサービスを登録します。次に、Grafanaサービスを開始して有効にします。
sudo systemctl daemon-reload sudo systemctl start grafana-server sudo systemctl enable grafana-server.service -
Grafanaがインストールされて実行されるようになりました。ブラウザでHTTP://prometheus-server:3000にアクセスすると、Grafanaのログインページが表示されます。
-
デフォルトのログインクレデンシャルはadmin / adminであり、新しいパスワードを要求されたときに設定する必要があります。
StorageGRID に対応したGrafanaダッシュボードを作成します
GrafanaとPrometheusがインストールされて実行されている状態で、データソースを作成してダッシュボードを構築することで、この2つを接続する時間が発生します
-
左側のペインで[構成]を展開し、[データソース]を選択して、[データソースの追加]ボタンをクリックします
-
Prometheusは、最も人気のあるデータソースの1つです。検出されていない場合は、検索バーで「Prometheus」を特定します。
-
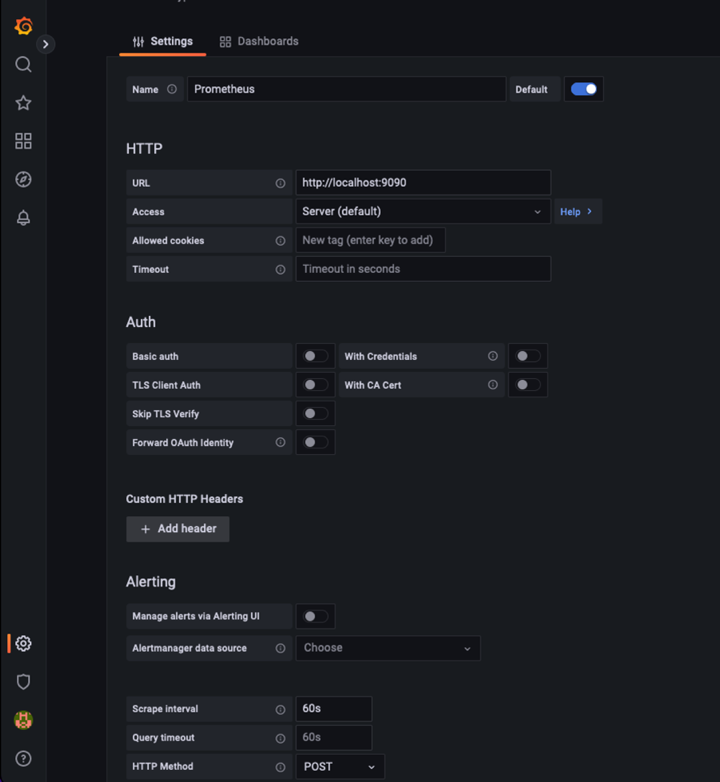
PrometheusインスタンスのURLとスクラビング間隔をPrometheusの間隔と一致するように入力して、Prometheusソースを設定します。Prometheusでアラートマネージャを設定しなかったため、アラートセクションも無効にしました。
-
目的の設定を入力したら、下にスクロールして[保存してテスト]をクリックします。
-
設定テストが正常に完了したら、[EXPLOR]ボタンをクリックします。
-
「調査」ウィンドウで、Prometheusで「storagegrid_node_name」に対してテストしたものと同じ指標を使用し、「Run query」ボタンをクリックします
-
-
データソースを設定したら、ダッシュボードを作成します。
-
左側のペインで[ダッシュボード]を展開し、[+新しいダッシュボード]を選択します。
-
「新規パネルを追加」を選択します。
-
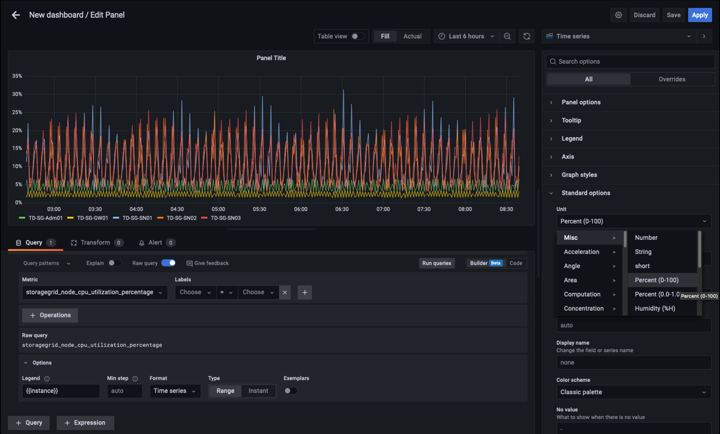
メトリックを選択して新しいパネルを設定します。もう一度「storagegrid_node_name」を使用し、パネルのタイトルを入力し、下部に「Options」を展開して凡例をカスタムに変更し、「{{instance}}」と入力してノード名を定義します。右側のペインの「Standard options」set "Unit」を「Misc-100%」に設定します。[適用]をクリックして、パネルをダッシュボードに保存します。
-
-
必要な指標ごとにこのようなダッシュボードを構築し続けることもできますが、幸運にも、StorageGRID にはダッシュボードがすでに用意されており、カスタムダッシュボードにコピーすることができます。
-
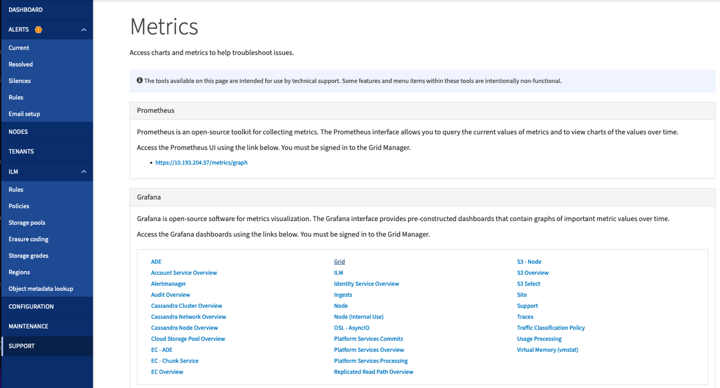
StorageGRID 管理インターフェイスの左側のペインで、[サポート]を選択し、[ツール]列の下部にある[指標]をクリックします。
-
指標内で、中央の列の上部にある「グリッド」リンクを選択します。
-
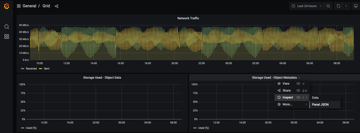
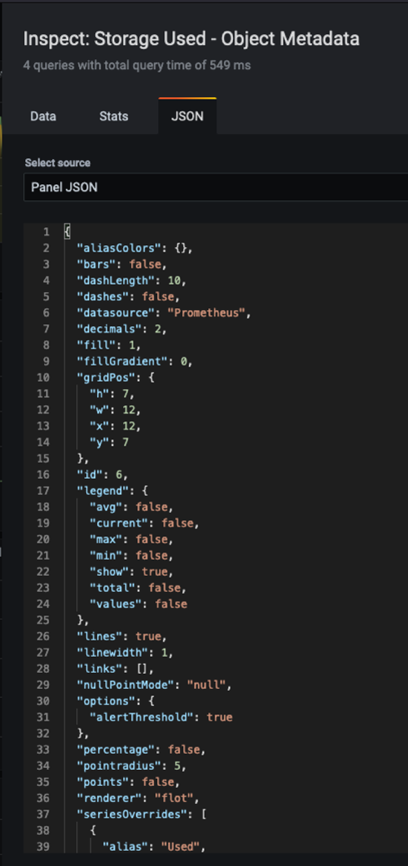
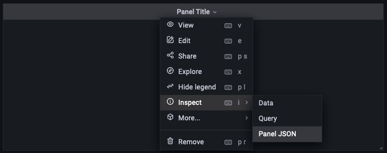
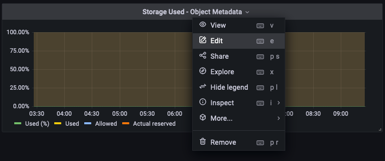
グリッドダッシュボードで、「Storage Used - Object Metadata」パネルを選択します。メニューをドロップダウンするには、パネルタイトルの小さな下向き矢印と末尾をクリックします。このメニューから「Inspect」と「Panel JSON」を選択します。
-
JSONコードをコピーしてウィンドウを閉じます。
-
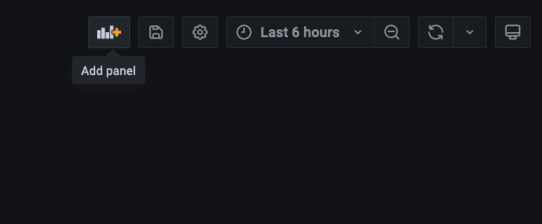
新しいダッシュボードで、アイコンをクリックして新しいパネルを追加します。
-
変更を加えずに新しいパネルを適用します
-
StorageGRID パネルと同様に、JSONを確認します。JSONコードをすべて削除し、StorageGRID パネルからコピーしたコードに置き換えます。
-
新しいパネルを編集すると、右側に「移行」ボタンを含む移行メッセージが表示されます。ボタンをクリックして、[適用]ボタンをクリックします。
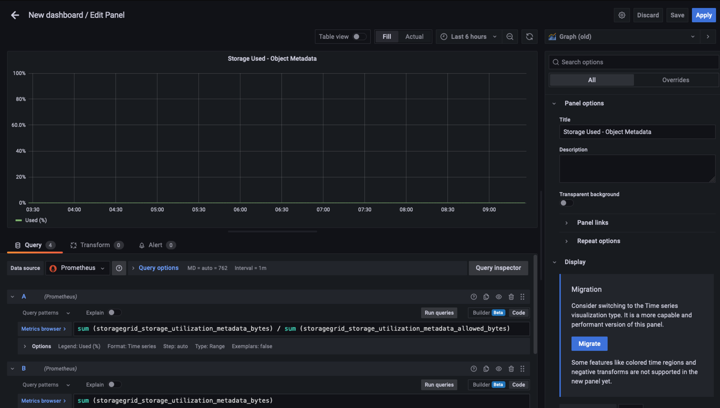
-
-
すべてのパネルを所定の位置に配置し、必要に応じて構成したら、右上のディスクアイコンをクリックしてダッシュボードを保存し、名前を付けます。
まとめ
カスタマイズ可能なデータ保持機能とストレージ容量を備えたPrometheusサーバを導入しました。そのため、運用に最も関連性の高い指標を使用して独自のダッシュボードを構築し続けることができます。で収集されたPrometheus指標の詳細を確認できます "StorageGRID のドキュメント"。