

HAProxy Data Collector
 Suggest changes
Data Infrastructure Insights uses this data collector to gather metrics from HAProxy.

|
This collector is deprecated. It will no longer be available starting January 2027. |
Installation
-
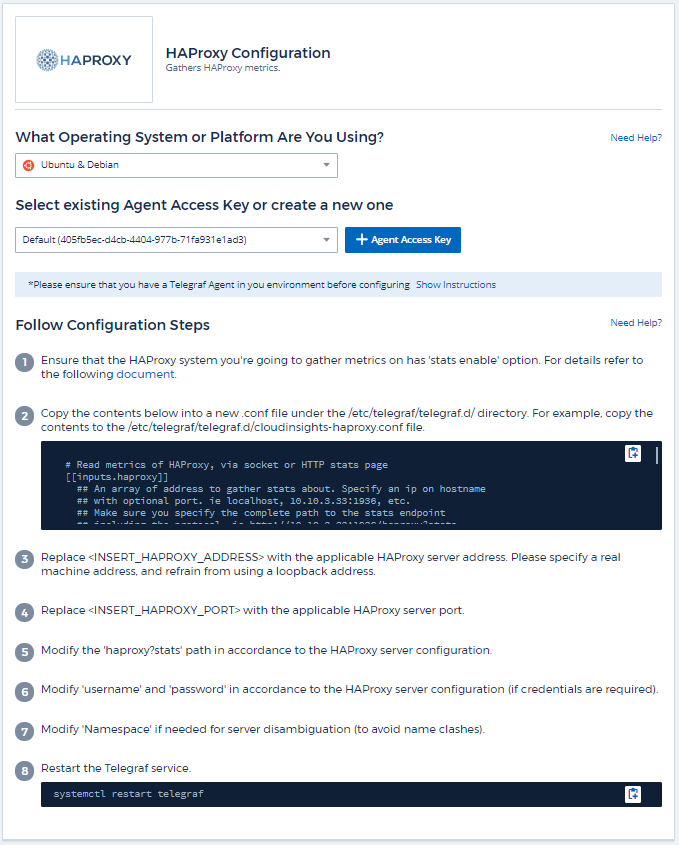
From Observability > Collectors, click +Data Collector. Choose HAProxy.
Select the Operating System or Platform on which the Telegraf agent is installed.
-
If you haven't already installed an Agent for collection, or you wish to install an Agent for a different Operating System or Platform, click Show Instructions to expand the Agent installation instructions.
-
Select the Agent Access Key for use with this data collector. You can add a new Agent Access Key by clicking the + Agent Access Key button. Best practice: Use a different Agent Access Key only when you want to group data collectors, for example, by OS/Platform.
-
Follow the configuration steps to configure the data collector. The instructions vary depending on the type of Operating System or Platform you are using to collect data.
Setup
Telegraf's plugin for HAProxy relies on HAProxy Stats enablement. This is a configuration built into HAProxy but it is not enabled out of the box. When enabled, HAProxy will expose an HTML endpoint that can be viewed on your browser or scraped for extraction of status of all HAProxy configurations.
Compatibility:
Configuration was developed against HAProxy version 1.9.4.
Setting Up:
To enable stats, edit your haproxy configuration file and add the the following lines after the 'defaults' section, using your own user/password and/or haproxy URL:
stats enable
stats auth myuser:mypassword
stats uri  /haproxy?stats
The following is a simplified example configuration file with stats enabled:
global
  daemon
  maxconn 256

defaults
  mode http
  stats enable
  stats uri /haproxy?stats
  stats auth myuser:mypassword
  timeout connect 5000ms
  timeout client 50000ms
  timeout server 50000ms

frontend http-in
  bind *:80
  default_backend servers

frontend http-in9080
  bind *:9080
  default_backend servers_2

backend servers
  server server1 10.128.0.55:8080 check ssl verify none
  server server2 10.128.0.56:8080 check ssl verify none

backend servers_2
  server server3 10.128.0.57:8080 check ssl verify none
  server server4 10.128.0.58:8080 check ssl verify none
For complete and up to date instructions, see the HAProxy documentation.
Objects and Counters
The following objects and their counters are collected:
| Object: | Identifiers: | Attributes: | Datapoints: |
|---|---|---|---|
HAProxy Frontend |
Namespace |
Node IP |
Bytes In |
HAProxy Server |
Namespace |
Node IP |
Active Servers |
HAProxy Backend |
Namespace |
Node IP |
Active Servers |
Troubleshooting
Additional information may be found from the Support page.