

Monitor the health of Keystone Collector
 Suggest changes
You can monitor the health of Keystone Collector by using any monitoring system that supports HTTP requests. Monitoring the health can help to ensure that data is available on the Keystone dashboard.
By default, Keystone health services do not accept connections from any IP other than localhost. The Keystone health endpoint is /uber/health, and it listens on all interfaces of the Keystone Collector server on port 7777. On query, an HTTP request status code with a JSON output is returned from the endpoint as a response, describing the status of the Keystone Collector system.
The JSON body provides an overall health status for the is_healthy attribute, which is a boolean; and a detailed list of statuses per-component for the component_details attribute.
Here is an example:
$ curl http://127.0.0.1:7777/uber/health
{"is_healthy": true, "component_details": {"vicmet": "Running", "ks-collector": "Running", "ks-billing": "Running", "chronyd": "Running"}}
These status codes are returned:
-
200: indicates that all monitored components are healthy
-
503: indicates that one or more components are unhealthy
-
403: indicates that the HTTP client querying the health status is not on the allow list, which is a list of allowed network CIDRs. For this status, no health information is returned.
The allow list uses the network CIDR method to control which network devices are allowed to query the Keystone health system. If you receive this error, add your monitoring system to the allow list from Keystone Collector management TUI > Configure > Health Monitoring.

|
Linux users, note this known issue:
Issue description: Keystone Collector runs a number of containers as part of the usage metering system. When the Red Hat Enterprise Linux 8.x server is hardened with USA Defense Information Systems Agency (DISA) Security Technical Implementation Guides (STIG) policies, a known issue with fapolicyd (File Access Policy Daemon) has been seen intermittently. This issue is identified as bug 1907870.Workaround: Until resolved by Red Hat Enterprise, NetApp recommends that you work around this issue by putting fapolicyd into permissive mode. In /etc/fapolicyd/fapolicyd.conf, set the value of permissive = 1.
|
View system logs
You can view Keystone Collector system logs to review system information and perform troubleshooting by using those logs. Keystone Collector uses the host's journald logging system, and the system logs can be reviewed through the standard journalctl system utility. You can avail the following key services to examine the logs:
-
ks-collector
-
ks-health
-
ks-autoupdate
The main data collection service ks-collector produces logs in JSON format with a run-id attribute associated with each scheduled data collection job. The following is an example of a successful job for standard usage data collection:
{"level":"info","time":"2022-10-31T05:20:01.831Z","caller":"light-collector/main.go:31","msg":"initialising light collector with run-id cdflm0f74cgphgfon8cg","run-id":"cdflm0f74cgphgfon8cg"}
{"level":"info","time":"2022-10-31T05:20:04.624Z","caller":"ontap/service.go:215","msg":"223 volumes collected for cluster a2049dd4-bfcf-11ec-8500-00505695ce60","run-id":"cdflm0f74cgphgfon8cg"}

{"level":"info","time":"2022-10-31T05:20:18.821Z","caller":"ontap/service.go:215","msg":"697 volumes collected for cluster 909cbacc-bfcf-11ec-8500-00505695ce60","run-id":"cdflm0f74cgphgfon8cg"}

{"level":"info","time":"2022-10-31T05:20:41.598Z","caller":"ontap/service.go:215","msg":"7 volumes collected for cluster f7b9a30c-55dc-11ed-9c88-005056b3d66f","run-id":"cdflm0f74cgphgfon8cg"}

{"level":"info","time":"2022-10-31T05:20:48.247Z","caller":"ontap/service.go:215","msg":"24 volumes collected for cluster a9e2dcff-ab21-11ec-8428-00a098ad3ba2","run-id":"cdflm0f74cgphgfon8cg"}

{"level":"info","time":"2022-10-31T05:20:48.786Z","caller":"worker/collector.go:75","msg":"4 clusters collected","run-id":"cdflm0f74cgphgfon8cg"}

{"level":"info","time":"2022-10-31T05:20:48.839Z","caller":"reception/reception.go:75","msg":"Sending file 65a71542-cb4d-bdb2-e9a7-a826be4fdcb7_1667193648.tar.gz type=ontap to reception","run-id":"cdflm0f74cgphgfon8cg"}

{"level":"info","time":"2022-10-31T05:20:48.840Z","caller":"reception/reception.go:76","msg":"File bytes 123425","run-id":"cdflm0f74cgphgfon8cg"}

{"level":"info","time":"2022-10-31T05:20:51.324Z","caller":"reception/reception.go:99","msg":"uploaded usage file to reception with status 201 Created","run-id":"cdflm0f74cgphgfon8cg"}
The following is an example of a successful job for optional performance data collection:
{"level":"info","time":"2022-10-31T05:20:51.324Z","caller":"sql/service.go:28","msg":"initialising MySql service at 10.128.114.214"}

{"level":"info","time":"2022-10-31T05:20:51.324Z","caller":"sql/service.go:55","msg":"Opening MySql db connection at server 10.128.114.214"}

{"level":"info","time":"2022-10-31T05:20:51.324Z","caller":"sql/service.go:39","msg":"Creating MySql db config object"}

{"level":"info","time":"2022-10-31T05:20:51.324Z","caller":"sla_reporting/service.go:69","msg":"initialising SLA service"}

{"level":"info","time":"2022-10-31T05:20:51.324Z","caller":"sla_reporting/service.go:71","msg":"SLA service successfully initialised"}

{"level":"info","time":"2022-10-31T05:20:51.324Z","caller":"worker/collector.go:217","msg":"Performance data would be collected for timerange: 2022-10-31T10:24:52~2022-10-31T10:29:52"}

{"level":"info","time":"2022-10-31T05:21:31.385Z","caller":"worker/collector.go:244","msg":"New file generated: 65a71542-cb4d-bdb2-e9a7-a826be4fdcb7_1667193651.tar.gz"}

{"level":"info","time":"2022-10-31T05:21:31.385Z","caller":"reception/reception.go:75","msg":"Sending file 65a71542-cb4d-bdb2-e9a7-a826be4fdcb7_1667193651.tar.gz type=ontap-perf to reception","run-id":"cdflm0f74cgphgfon8cg"}

{"level":"info","time":"2022-10-31T05:21:31.386Z","caller":"reception/reception.go:76","msg":"File bytes 17767","run-id":"cdflm0f74cgphgfon8cg"}

{"level":"info","time":"2022-10-31T05:21:33.025Z","caller":"reception/reception.go:99","msg":"uploaded usage file to reception with status 201 Created","run-id":"cdflm0f74cgphgfon8cg"}

{"level":"info","time":"2022-10-31T05:21:33.025Z","caller":"light-collector/main.go:88","msg":"exiting","run-id":"cdflm0f74cgphgfon8cg"}
Generate and collect support bundles
The Keystone Collector TUI enables you to generate support bundles and add then to service requests for resolving support issues. Follow this procedure:
-
Start the Keystone Collector management TUI utility:
$ keystone-collector-tui -
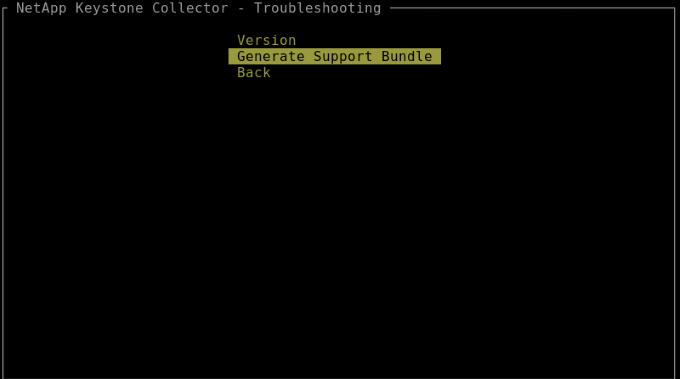
Go to Troubleshooting > Generate Support Bundle.
-
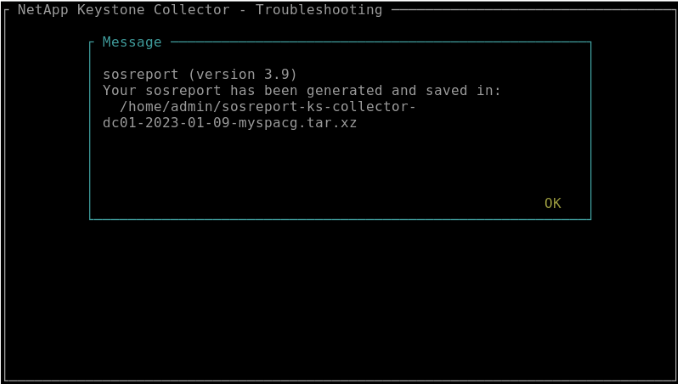
When generated, the location where the bundle is saved is displayed. Use FTP, SFTP, or SCP to connect to the location and download the log file to a local system.
-
When the file is downloaded, you can attach it to the Keystone ServiceNow support ticket. For information about raising tickets, see Generating service requests.