

Monitor jobs
 Suggest changes
After performing any data protection operation using the VMware vSphere web client, you can monitor the job status from the Job Monitor tab in the Dashboard and view job details.
-
In the left Navigator pane of the vSphere web client, click Dashboard, select a vCenter Server, and then click the Job Monitor tab.
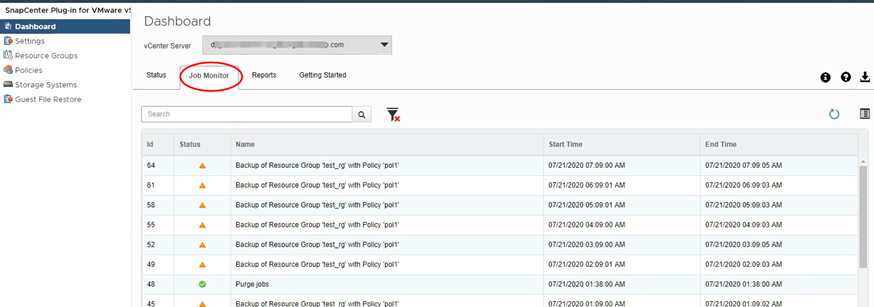
The Job Monitor tab lists each job and its status, start time, and end time. If the job names are long, you might need to scroll to the right to view the start and end times. The display is refreshed every 30 seconds.
-
Click the
 refresh icon in the toolbar to refresh the display on-demand.
 -
Click the
 filter icon to select the time range, type, tag, and status of jobs you want displayed. The filter is case sensitive.
 -
Click the
refresh icon in the Job Details window to refresh the display while the job is running.
-
If the Dashboard does not display job information, see the KB article: SnapCenter vSphere web client dashboard does not display jobs.