Reviewing support metrics
 Suggest changes
When troubleshooting an issue, you can work with technical support to review detailed metrics and charts for your StorageGRID system.
-
You must be signed in to the Grid Manager using a supported browser.
-
You must have specific access permissions.
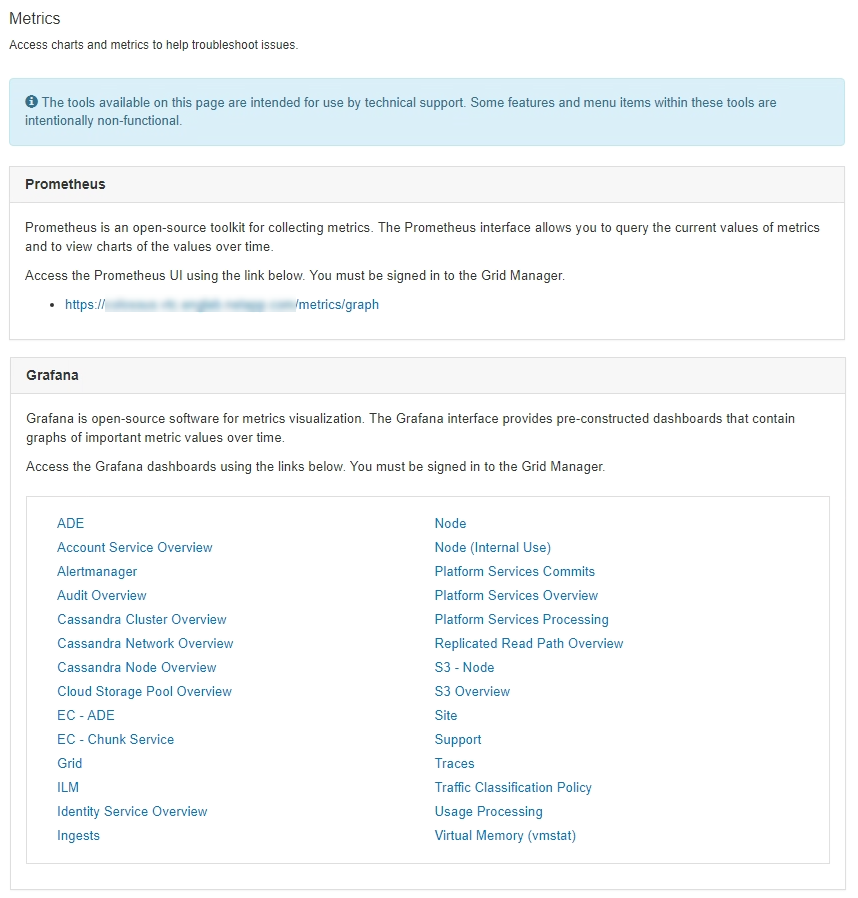
The Metrics page allows you to access the Prometheus and Grafana user interfaces. Prometheus is open-source software for collecting metrics. Grafana is open-source software for metrics visualization.

|
The tools available on the Metrics page are intended for use by technical support. Some features and menu items within these tools are intentionally non-functional and are subject to change. |
-
As directed by technical support, select Support > Tools > Metrics.
The Metrics page appears.
-
To query the current values of StorageGRID metrics and to view graphs of the values over time, click the link in the Prometheus section.
The Prometheus interface appears. You can use this interface to execute queries on the available StorageGRID metrics and to graph StorageGRID metrics over time.
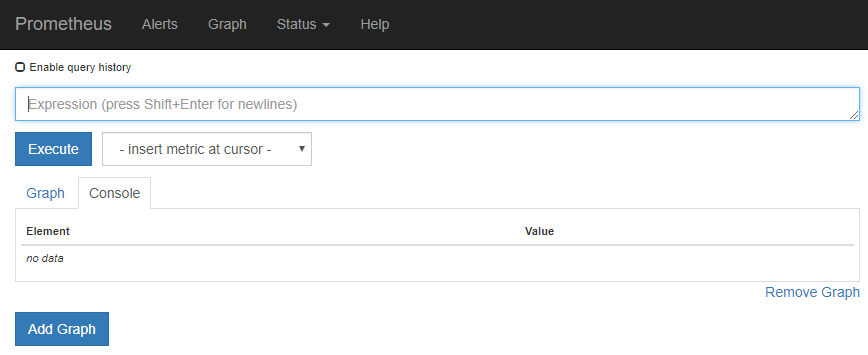

Metrics that include private in their names are intended for internal use only and are subject to change between StorageGRID releases without notice. -
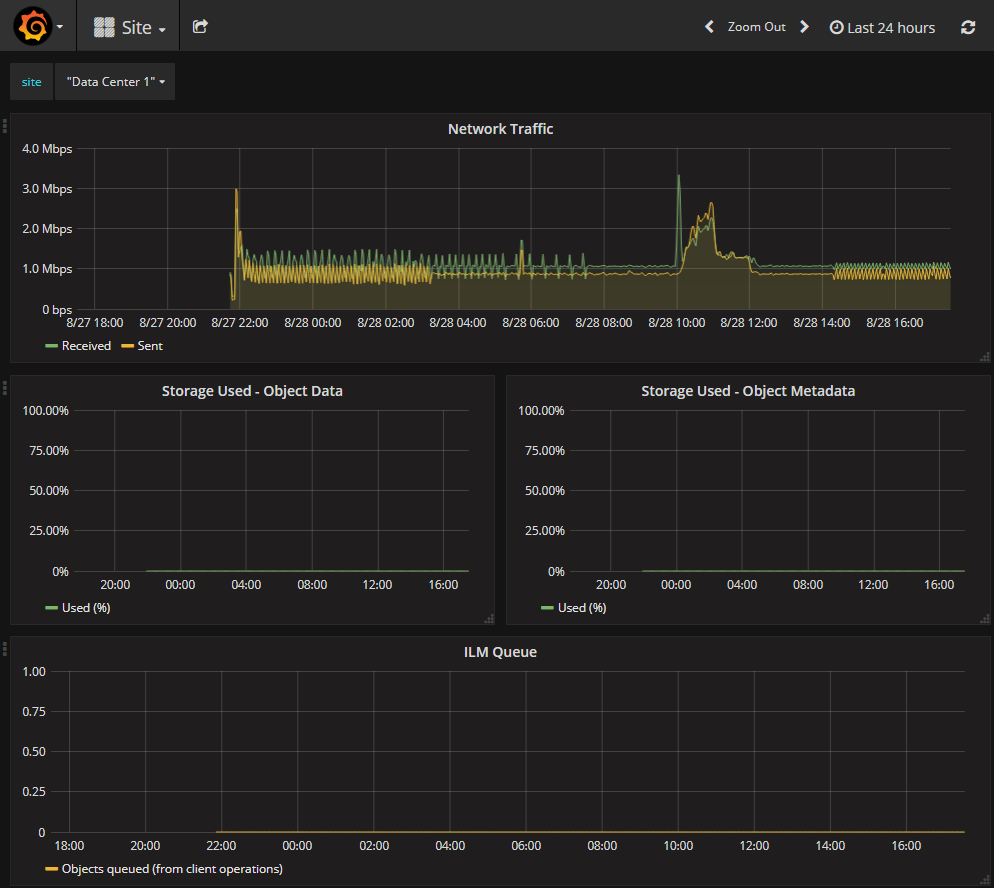
To access pre-constructed dashboards containing graphs of StorageGRID metrics over time, click the links in the Grafana section.
The Grafana interface for the link you selected appears.