Prometheus metrics
 Suggest changes


The Prometheus service on Admin Nodes collects time series metrics from the services on all nodes.
The metrics collected by Prometheus are used in a number of places in the Grid Manager:
-
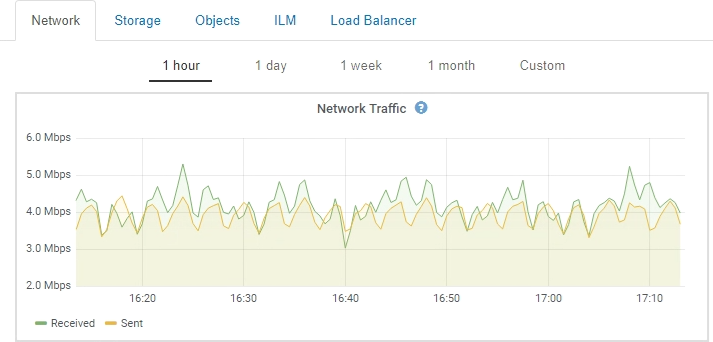
Nodes page: The graphs and charts on the tabs available from the Nodes page use the Grafana visualization tool to display the time-series metrics collected by Prometheus. Grafana displays time-series data in graph and chart formats, while Prometheus serves as the backend data source.

-
Alerts: Alerts are triggered at specific severity levels when alert rule conditions that use Prometheus metrics evaluate as true.
-
Grid Management API: You can use Prometheus metrics in custom alert rules or with external automation tools to monitor your StorageGRID system. A complete list of Prometheus metrics is available from the Grid Management API (Help > API Documentation > Metrics). While more than a thousand metrics are available, only a relatively small number are required to monitor the most critical StorageGRID operations.
Metrics that include private in their names are intended for internal use only and are subject to change between StorageGRID releases without notice. -
The Support > Tools > Diagnostics page and the Support > Tools > Metrics page: These pages, which are primarily intended for use by technical support, provide a number of tools and charts that use the values of Prometheus metrics.
Some features and menu items within the Metrics page are intentionally non-functional and are subject to change.


