View the Hardware tab
 Suggest changes
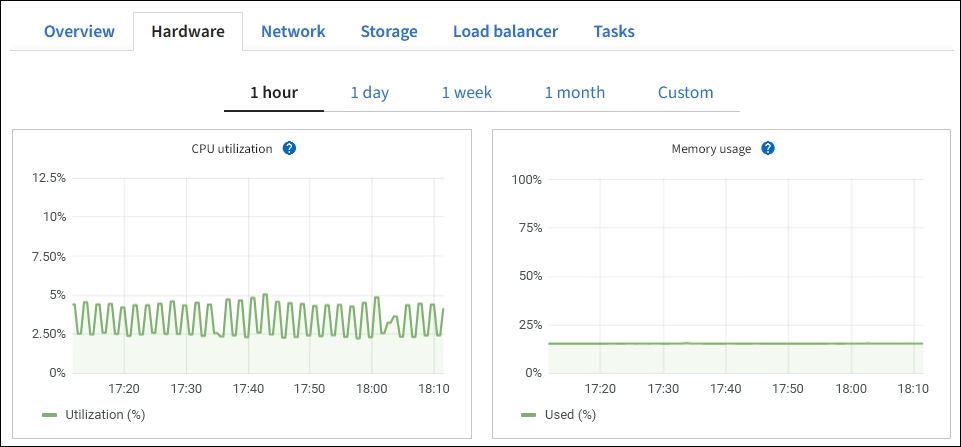
The Hardware tab displays CPU utilization and memory usage for each node, and additional hardware information about appliances.
The Hardware tab is shown for all nodes.
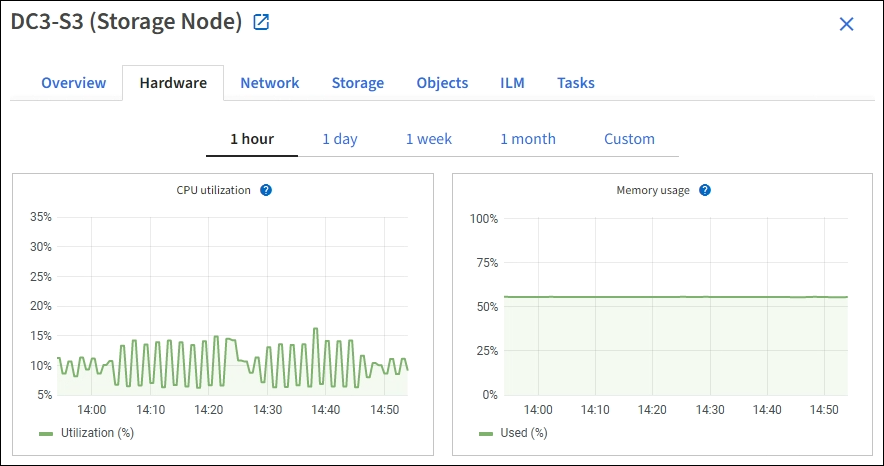
To display a different time interval, select one of the controls above the chart or graph. You can display the information available for intervals of 1 hour, 1 day, 1 week, or 1 month. You can also set a custom interval, which allows you to specify date and time ranges.
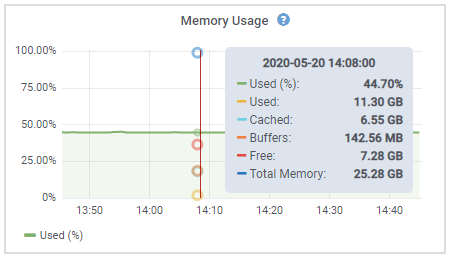
To see details for CPU utilization and memory usage, hover your cursor over each graph.
If the node is an appliance node, this tab also includes a section with more information about the appliance hardware.
View information about appliance Storage Nodes
The Nodes page lists information about service health and all computational, disk device, and network resources for each appliance Storage Node. You can also see memory, storage hardware, controller firmware version, network resources, network interfaces, network addresses, and receive and transmit data.
-
From the Nodes page, select an appliance Storage Node.
-
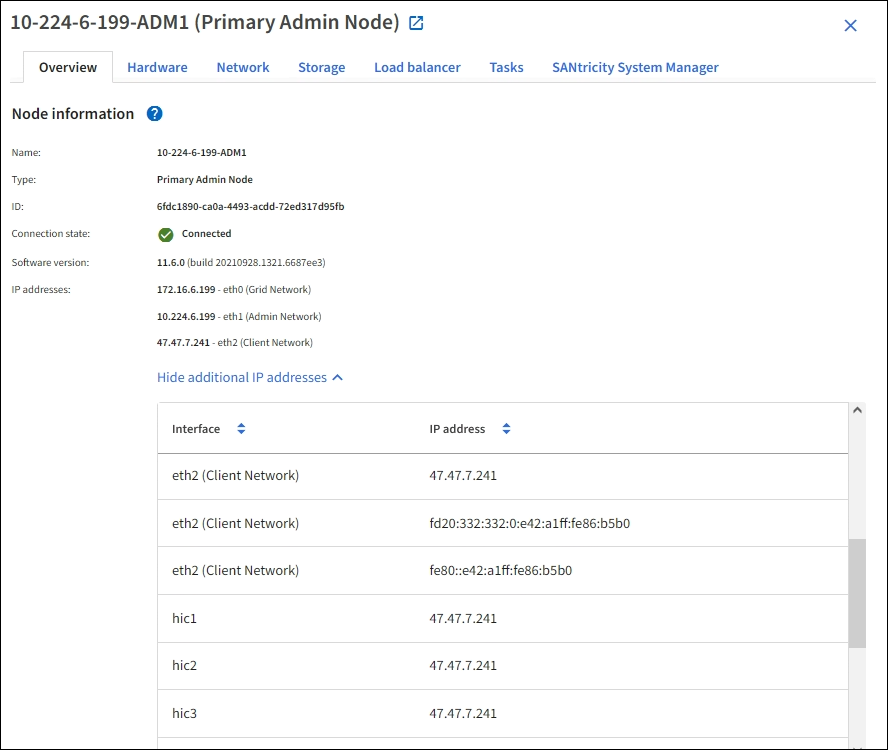
Select Overview.
The Node information section of the Overview tab displays summary information for the node, such as the node's name, type, ID, and connection state. The list of IP addresses includes the name of the interface for each address, as follows:
-
eth: The Grid Network, Admin Network, or Client Network.
-
hic: One of the physical 10, 25, or 100 GbE ports on the appliance. These ports can be bonded together and connected to the StorageGRID Grid Network (eth0) and Client Network (eth2).
-
mtc: One of the physical 1 GbE ports on the appliance. One or more mtc interfaces are bonded to form the StorageGRID Admin Network interface (eth1). You can leave other mtc interfaces available for temporary local connectivity for a technician in the data center.
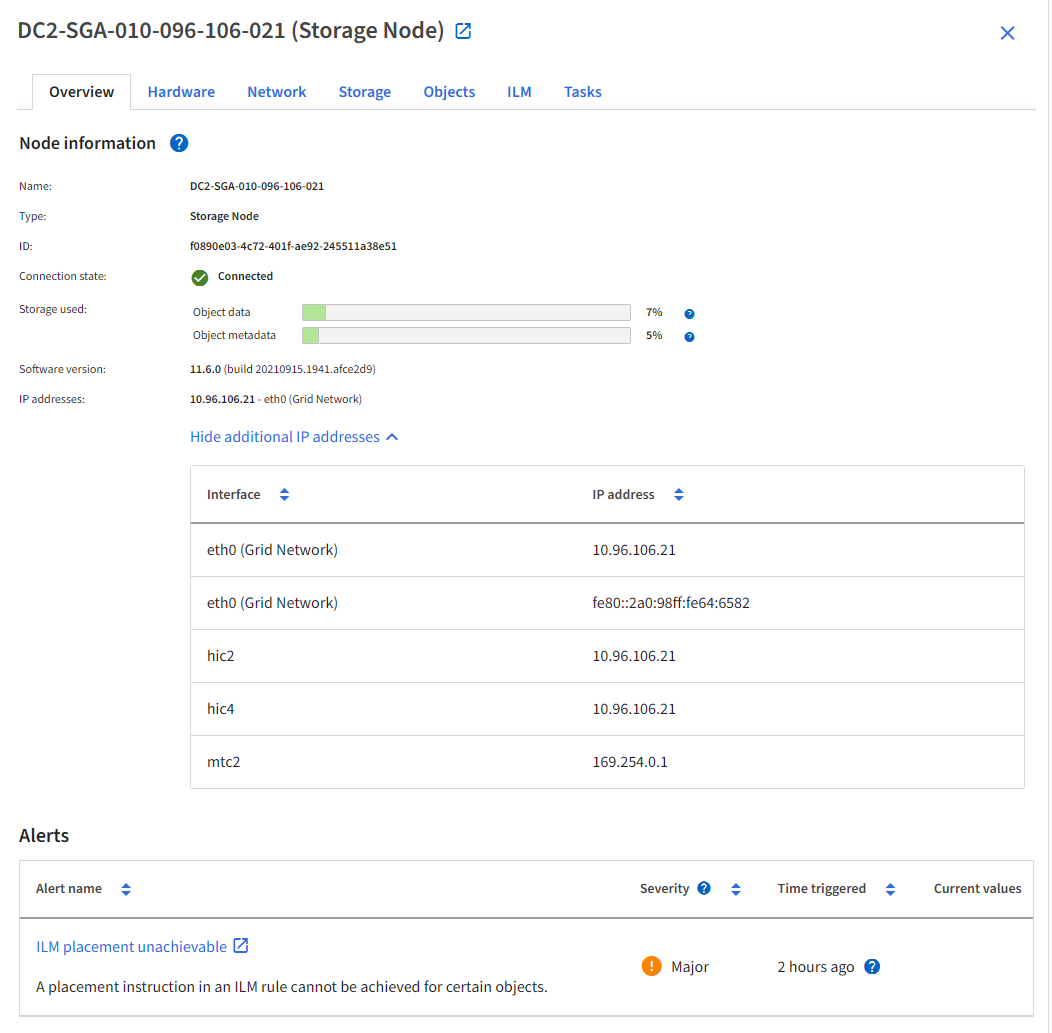
The Alerts section of the Overview tab displays any active alerts for the node.
-
-
Select Hardware to see more information about the appliance.
-
View the CPU Utilization and Memory graphs to determine the percentages of CPU and memory usage over time. To display a different time interval, select one of the controls above the chart or graph. You can display the information available for intervals of 1 hour, 1 day, 1 week, or 1 month. You can also set a custom interval, which allows you to specify date and time ranges.
-
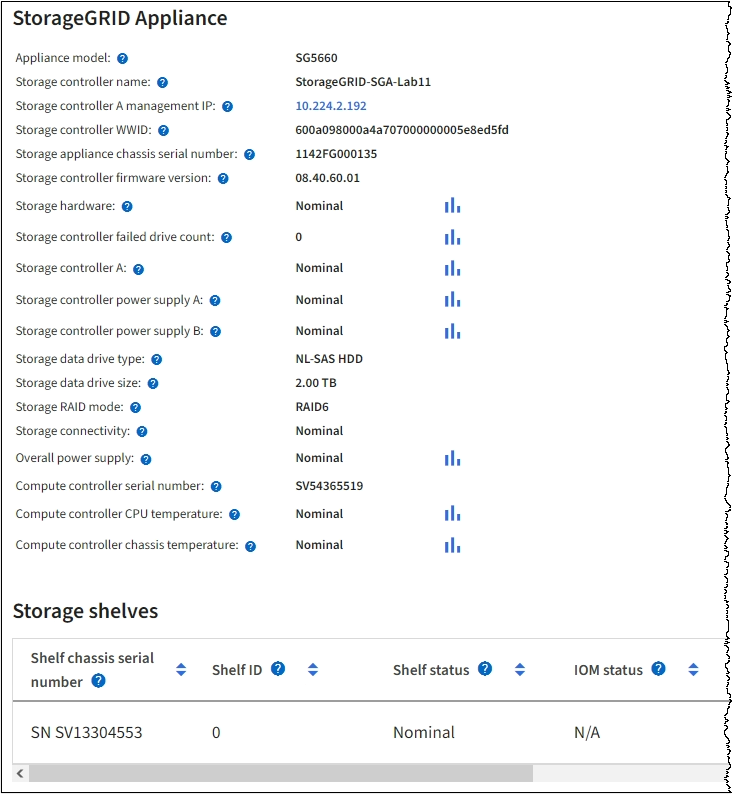
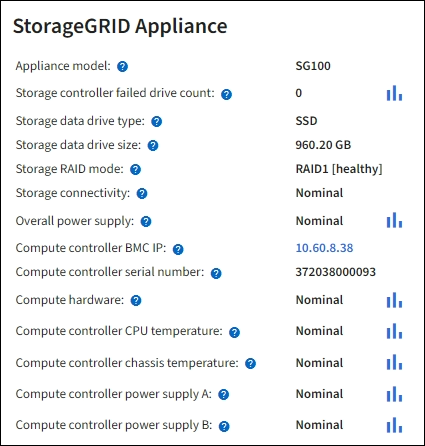
Scroll down to view the table of components for the appliance. This table contains information such as the model name of the appliance; controller names, serial numbers, and IP addresses; and the status of each component.

Some fields, such as Compute controller BMC IP and Compute hardware, appear only for appliances with that feature. Components for the storage shelves, and expansion shelves if they are part of the installation, appear in a separate table below the appliance table.
Field in the Appliance table Description Appliance model
The model number for this StorageGRID appliance shown in SANtricity software.
Storage controller name
The name for this StorageGRID appliance shown in SANtricity software.
Storage controller A management IP
IP address for management port 1 on storage controller A. You use this IP to access SANtricity software to troubleshoot storage issues.
Storage controller B management IP
IP address for management port 1 on storage controller B. You use this IP to access SANtricity software to troubleshoot storage issues.
Some appliance models do not have a storage controller B.
Storage controller WWID
The worldwide identifier of the storage controller shown in SANtricity software.
Storage appliance chassis serial number
The chassis serial number of the appliance.
Storage controller firmware version
The version of the firmware on the storage controller for this appliance.
Storage hardware
The overall status of the storage controller hardware. If SANtricity System Manager reports a status of Needs Attention for the storage hardware, the StorageGRID system also reports this value.
If the status is “needs attention,” first check the storage controller using SANtricity software. Then, ensure that no other alarms exist that apply to the compute controller.
Storage controller failed drive count
The number of drives that are not optimal.
Storage controller A
The status of storage controller A.
Storage controller B
The status of storage controller B. Some appliance models do not have a storage controller B.
Storage controller power supply A
The status of power supply A for the storage controller.
Storage controller power supply B
The status of power supply B for the storage controller.
Storage data drive type
The type of drives in the appliance, such as HDD (hard disk drive) or SSD (solid state drive).
Storage data drive size
The effective size of one data drive.
Note: For nodes with expansion shelves, use the Data drive size for each shelf instead. Effective drive size might differ by shelf.
Storage RAID mode
The RAID mode configured for the appliance.
Storage connectivity
The storage connectivity state.
Overall power supply
The status of all power supplies for the appliance.
Compute controller BMC IP
The IP address of the baseboard management controller (BMC) port in the compute controller. You use this IP to connect to the BMC interface to monitor and diagnose the appliance hardware.
This field is not displayed for appliance models that do not contain a BMC.
Compute controller serial number
The serial number of the compute controller.
Compute hardware
The status of the compute controller hardware. This field is not displayed for appliance models that do not have separate compute hardware and storage hardware.
Compute controller CPU temperature
The temperature status of the compute controller's CPU.
Compute controller chassis temperature
The temperature status of the compute controller.
Column in the Storage shelves table Description Shelf chassis serial number
The serial number for the storage shelf chassis.
Shelf ID
The numeric identifier for the storage shelf.
-
99: Storage controller shelf
-
0: First expansion shelf
-
1: Second expansion shelf
Note: Expansion shelves apply to the SG6060 and SG6060X only.
Shelf status
The overall status of the storage shelf.
IOM status
The status of the input/output modules (IOMs) in any expansion shelves. N/A if this is not an expansion shelf.
Power supply status
The overall status of the power supplies for the storage shelf.
Drawer status
The status of the drawers in the storage shelf. N/A if the shelf does not contain drawers.
Fan status
The overall status of the cooling fans in the storage shelf.
Drive slots
The total number of drive slots in the storage shelf.
Data drives
The number of drives in the storage shelf that are used for data storage.
The effective size of one data drive in the storage shelf.
Cache drives
The number of drives in the storage shelf that are used as cache.
Cache drive size
The size of the smallest cache drive in the storage shelf. Normally, cache drives are all the same size.
Configuration status
The configuration status of the storage shelf.
-
-
-
Confirm that all statuses are “Nominal.”
If a status is not “Nominal,” review any current alerts. You can also use SANtricity System Manager to learn more about some of these hardware values. See the instructions for installing and maintaining your appliance.
-
Select Network to view information for each network.
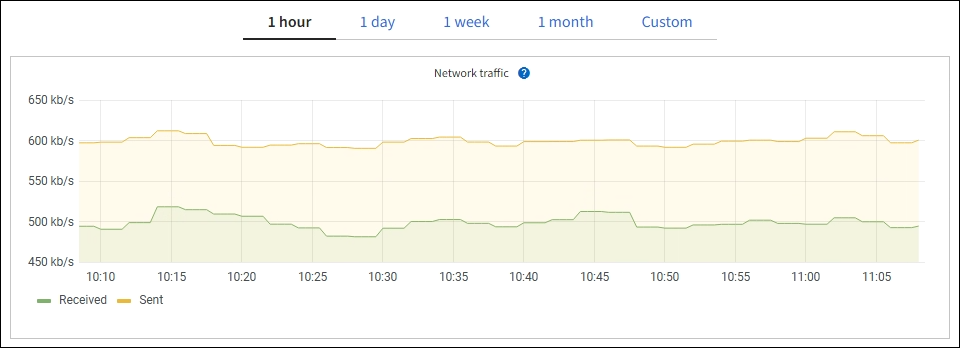
The Network Traffic graph provides a summary of overall network traffic.
-
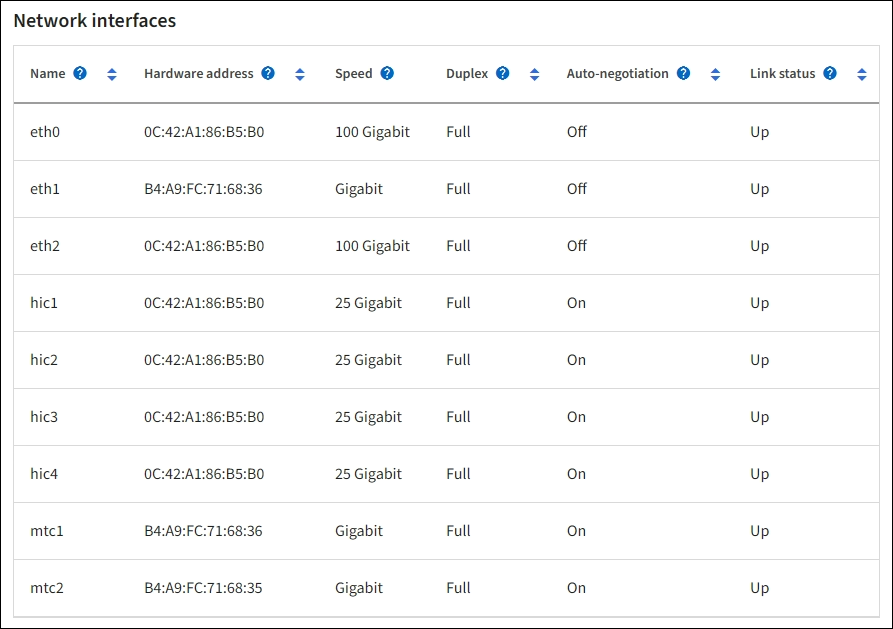
Review the Network Interfaces section.
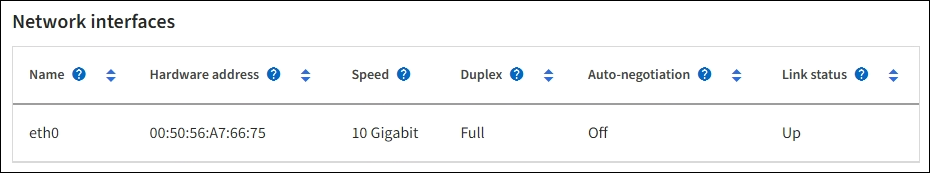
Use the following table with the values in the Speed column in the Network Interfaces table to determine whether the 10/25-GbE network ports on the appliance were configured to use active/backup mode or LACP mode.
The values shown in the table assume all four links are used. Link mode Bond mode Individual HIC link speed (hic1, hic2, hic3, hic4) Expected Grid/Client Network speed (eth0,eth2) Aggregate
LACP
25
100
Fixed
LACP
25
50
Fixed
Active/Backup
25
25
Aggregate
LACP
10
40
Fixed
LACP
10
20
Fixed
Active/Backup
10
10
See the installation and maintenance instructions for your appliance for more information about configuring the 10/25-GbE ports.
-
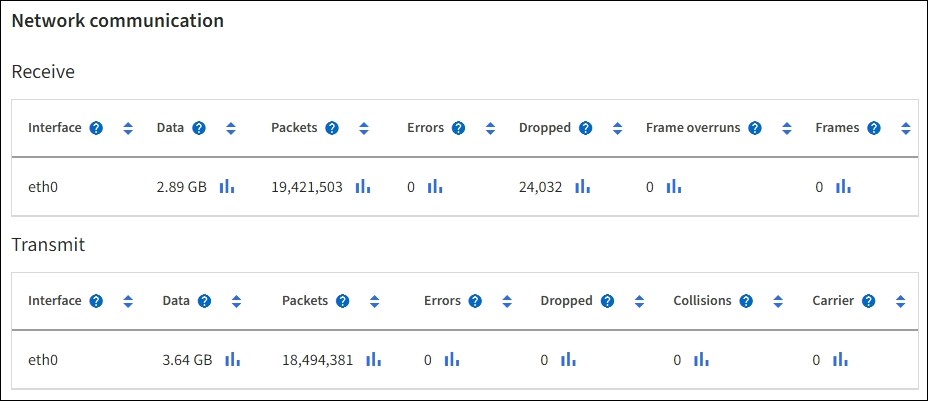
Review the Network Communication section.
The Receive and Transmit tables show how many bytes and packets have been received and sent across each network as well as other receive and transmit metrics.
-
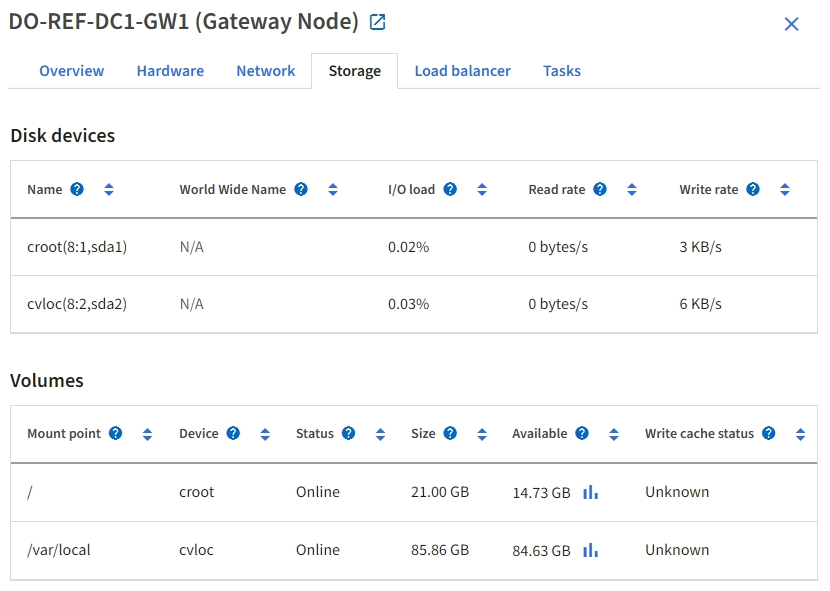
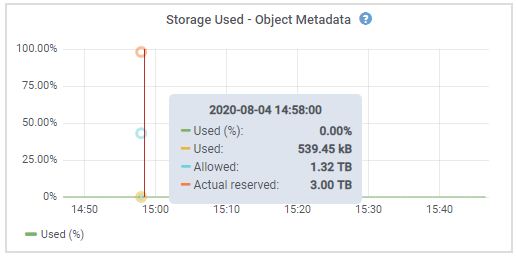
Select Storage to view graphs that show the percentages of storage used over time for object data and object metadata, as well as information about disk devices, volumes, and object stores.
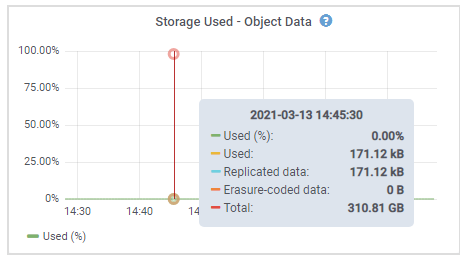
-
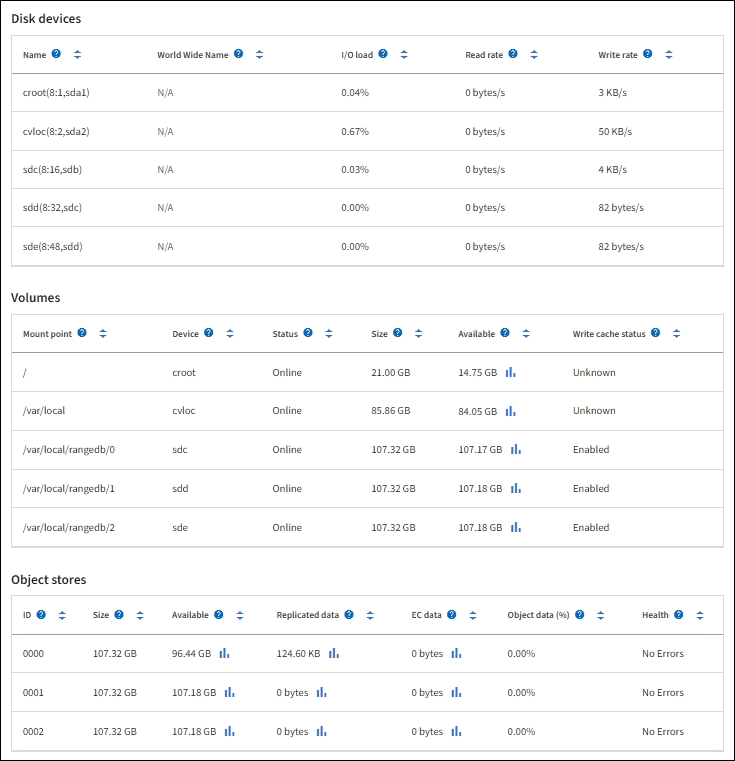
Scroll down to view the amounts of available storage for each volume and object store.
The Worldwide Name for each disk matches the volume world-wide identifier (WWID) that appears when you view standard volume properties in SANtricity software (the management software connected to the appliance's storage controller).
To help you interpret disk read and write statistics related to volume mount points, the first portion of the name shown in the Name column of the Disk Devices table (that is, sdc, sdd, sde, and so on) matches the value shown in the Device column of the Volumes table.
-
View information about appliance Admin Nodes and Gateway Nodes
The Nodes page lists information about service health and all computational, disk device, and network resources for each services appliance that is used as an Admin Node or a Gateway Node. You can also see memory, storage hardware, network resources, network interfaces, network addresses, and receive and transmit data.
-
From the Nodes page, select an appliance Admin Node or an appliance Gateway Node.
-
Select Overview.
The Node information section of the Overview tab displays summary information for the node, such as the node's name, type, ID, and connection state. The list of IP addresses includes the name of the interface for each address, as follows:
-
adllb and adlli: Shown if active/backup bonding is used for the Admin Network interface
-
eth: The Grid Network, Admin Network, or Client Network.
-
hic: One of the physical 10, 25, or 100 GbE ports on the appliance. These ports can be bonded together and connected to the StorageGRID Grid Network (eth0) and Client Network (eth2).
-
mtc: One of the physical 1-GbE ports on the appliance. One or more mtc interfaces are bonded to form the Admin Network interface (eth1). You can leave other mtc interfaces available for temporary local connectivity for a technician in the data center.
The Alerts section of the Overview tab displays any active alerts for the node.
-
-
Select Hardware to see more information about the appliance.
-
View the CPU Utilization and Memory graphs to determine the percentages of CPU and memory usage over time. To display a different time interval, select one of the controls above the chart or graph. You can display the information available for intervals of 1 hour, 1 day, 1 week, or 1 month. You can also set a custom interval, which allows you to specify date and time ranges.
-
Scroll down to view the table of components for the appliance. This table contains information such as the model name, serial number, controller firmware version, and the status of each component.
Field in the Appliance table Description Appliance model
The model number for this StorageGRID appliance.
Storage controller failed drive count
The number of drives that are not optimal.
Storage data drive type
The type of drives in the appliance, such as HDD (hard disk drive) or SSD (solid state drive).
Storage data drive size
The effective size of one data drive.
Storage RAID mode
The RAID mode for the appliance.
Overall power supply
The status of all power supplies in the appliance.
Compute controller BMC IP
The IP address of the baseboard management controller (BMC) port in the compute controller. You can use this IP to connect to the BMC interface to monitor and diagnose the appliance hardware.
This field is not displayed for appliance models that do not contain a BMC.
Compute controller serial number
The serial number of the compute controller.
Compute hardware
The status of the compute controller hardware.
Compute controller CPU temperature
The temperature status of the compute controller's CPU.
Compute controller chassis temperature
The temperature status of the compute controller.
-
Confirm that all statuses are “Nominal.”
If a status is not “Nominal,” review any current alerts.
-
-
Select Network to view information for each network.
The Network Traffic graph provides a summary of overall network traffic.
-
Review the Network Interfaces section.
Use the following table with the values in the Speed column in the Network Interfaces table to determine whether the four 40/100-GbE network ports on the appliance were configured to use active/backup mode or LACP mode.
The values shown in the table assume all four links are used. Link mode Bond mode Individual HIC link speed (hic1, hic2, hic3, hic4) Expected Grid/Client Network speed (eth0, eth2) Aggregate
LACP
100
400
Fixed
LACP
100
200
Fixed
Active/Backup
100
100
Aggregate
LACP
40
160
Fixed
LACP
40
80
Fixed
Active/Backup
40
40
-
Review the Network Communication section.
The Receive and Transmit tables show how many bytes and packets have been received and sent across each network as well as other receive and transmission metrics.
-
-
Select Storage to view information about the disk devices and volumes on the services appliance.