

Monitor events
 Suggest changes
You can monitor events that are detected by a grid node, including custom events that you have created to track events that are logged to the syslog server. The Last Event message shown in the Grid Manager provides more information about the most recent event.
Event messages are also listed in the /var/local/log/bycast-err.log log file. See the Log files reference.
The SMTT (Total events) alarm can be repeatedly triggered by issues such as network problems, power outages or upgrades. This section has information about investigating events so that you can better understand why these alarms have occurred. If an event occurred because of a known issue, it is safe to reset the event counters.
-
Review the system events for each grid node:
-
Select SUPPORT > Tools > Grid topology.
-
Select site > grid node > SSM > Events > Overview > Main.
-
-
Generate a list of previous event messages to help isolate issues that occurred in the past:
-
Select SUPPORT > Tools > Grid topology.
-
Select site > grid node > SSM > Events > Reports.
-
Select Text.
The Last Event attribute is not shown in the charts view. To view it:
-
Change Attribute to Last Event.
-
Optionally, select a time period for Quick Query.
-
Select Update.
-
Create custom syslog events
Custom events allow you to track all kernel, daemon, error and critical level user events logged to the syslog server. A custom event can be useful for monitoring the occurrence of system log messages (and thus network security events and hardware faults).
Consider creating custom events to monitor recurring problems. The following considerations apply to custom events.
-
After a custom event is created, every occurrence of it is monitored.
-
To create a custom event based on keywords in the
/var/local/log/messagesfiles, the logs in those files must be:-
Generated by the kernel
-
Generated by daemon or user program at the error or critical level
-
Note: Not all entries in the /var/local/log/messages files will be matched unless they satisfy the requirements stated above.
-
Select SUPPORT > Alarms (legacy) > Custom events.
-
Click Edit
 (or Insert
  if this is not the first event).
 -
Enter a custom event string, for example, shutdown
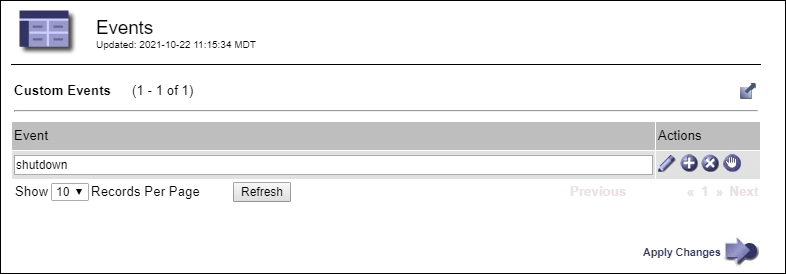
-
Select Apply Changes.
-
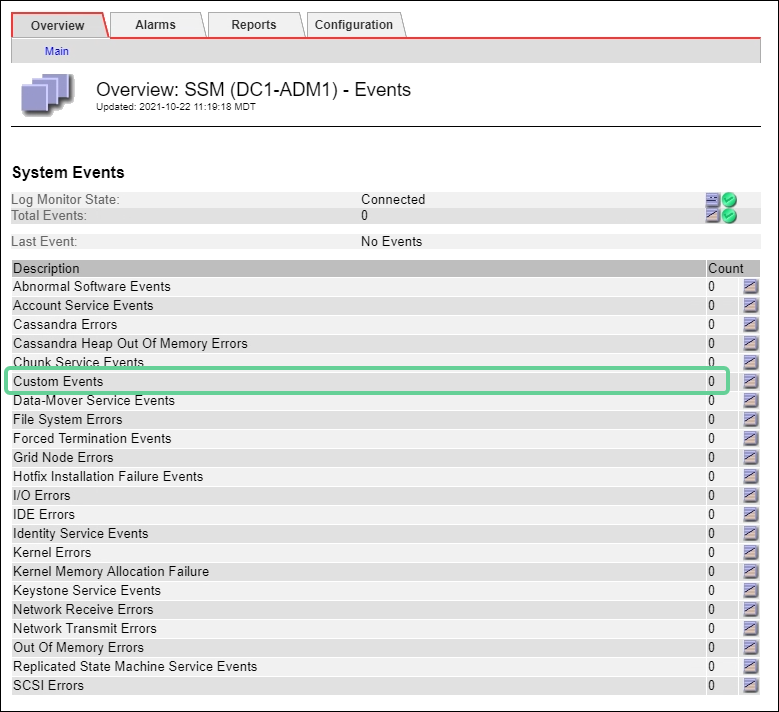
Select SUPPORT > Tools > Grid topology.
-
Select grid node > SSM > Events.
-
Locate the entry for Custom Events in the Events table, and monitor the value for Count.
If the count increases, a custom event you are monitoring is being triggered on that grid node.
Reset the count of custom events to zero
If you want to reset the counter only for custom events, you must use the Grid Topology page in the Support menu.
Resetting a counter causes the alarm to be triggered by the next event. In contrast, when you acknowledge an alarm, that alarm is only re-triggered if the next threshold level is reached.
-
Select SUPPORT > Tools > Grid topology.
-
Select grid node > SSM > Events > Configuration > Main.
-
Select the Reset checkbox for Custom Events.
-
Select Apply Changes.