Use text reports
 Suggest changes


Text reports display a textual representation of attribute data values that have been processed by the NMS service. There are two types of reports generated depending on the time period you are reporting on: raw text reports for periods less than a week, and aggregate text reports for time periods greater than a week.
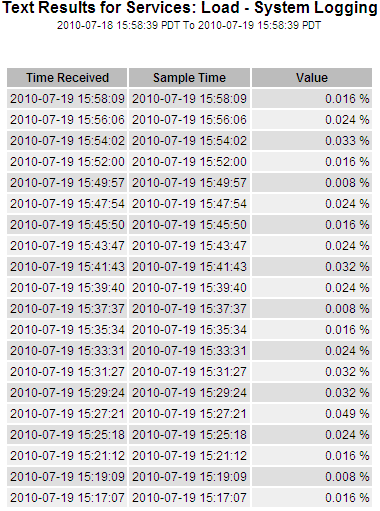
Raw text reports
A raw text report displays details about the selected attribute:
-
Time Received: Local date and time that a sample value of an attribute's data was processed by the NMS service.
-
Sample Time: Local date and time that an attribute value was sampled or changed at the source.
-
Value: Attribute value at sample time.

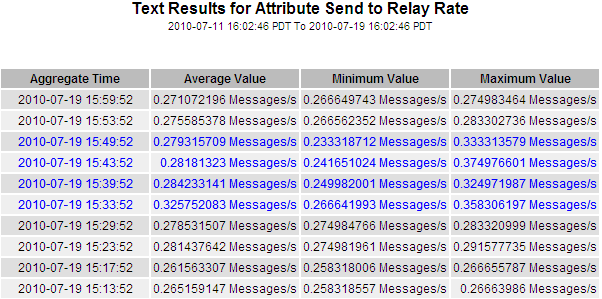
Aggregate text reports
An aggregate text report displays data over a longer period of time (usually a week) than a raw text report. Each entry is the result of summarizing multiple attribute values (an aggregate of attribute values) by the NMS service over time into a single entry with average, maximum, and minimum values that are derived from the aggregation.
Each entry displays the following information:
-
Aggregate Time: Last local date and time that the NMS service aggregated (collected) a set of changed attribute values.
-
Average Value: The average of the attribute's value over the aggregated time period.
-
Minimum Value: The minimum value over the aggregated time period.
-
Maximum Value: The maximum value over the aggregated time period.

Generate text reports
Text reports display a textual representation of attribute data values that have been processed by the NMS service. You can report on a data center site, grid node, component, or service.
-
You must be signed in to the Grid Manager using a supported web browser.
-
You must have specific access permissions.
For attribute data that is expected to be continuously changing, this attribute data is sampled by the NMS service (at the source) at regular intervals. For attribute data that changes infrequently (for example, data based on events such as state or status changes), an attribute value is sent to the NMS service when the value changes.
The type of report displayed depends on the configured time period. By default, aggregate text reports are generated for time periods longer than one week.
Gray text indicates the service was administratively down during the time it was sampled. Blue text indicates the service was in an unknown state.
-
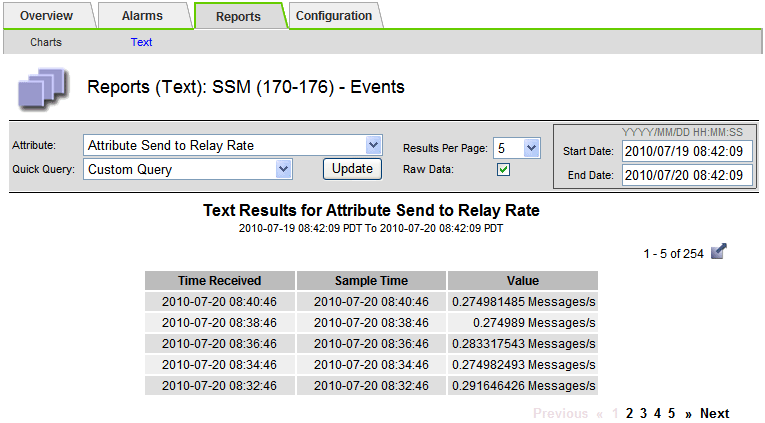
Select SUPPORT > Tools > Grid topology.
-
Select grid node > component or service > Reports > Text.
-
Select the attribute to report on from the Attribute drop-down list.
-
Select the number of results per page from the Results per Page drop-down list.
-
To round values to a maximum of three decimal places (for example, for attributes reported as percentages), clear the Raw Data checkbox.
-
Select the time period to report on from the Quick Query drop-down list.
Select the Custom Query option to select a specific time range.
The report appears after a few moments. Allow several minutes for tabulation of long time ranges.
-
If you selected Custom Query, you need to customize the time period to report on by entering the Start Date and End Date.
Use the format
YYYY/MM/DDHH:MM:SSin local time. Leading zeros are required to match the format. For example, 2017/4/6 7:30:00 fails validation. The correct format is: 2017/04/06 07:30:00. -
Click Update.
A text report is generated after a few moments. Allow several minutes for tabulation of long time ranges. Depending on the length of time set for the query, either a raw text report or aggregate text report is displayed.
Export text reports
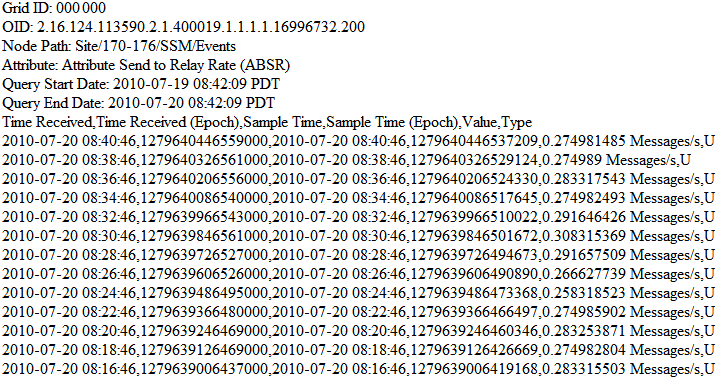
Exported text reports open a new browser tab, which enables you to select and copy the data.
The copied data can then be saved into a new document (for example, a spreadsheet) and used to analyze the performance of the StorageGRID system.
-
Select SUPPORT > Tools > Grid topology.
-
Create a text report.
-
Click *Export*
 .
.
The Export Text Report window opens displaying the report.

-
Select and copy the contents of the Export Text Report window.
This data can now be pasted into a third-party document such as a spreadsheet.


