

View the Nodes page: Overview
 Suggest changes
When you need more detailed information about your StorageGRID system than the dashboard provides, you can use the Nodes page to view metrics for the entire grid, each site in the grid, and each node at a site.
The Nodes table lists summary information for the entire grid, each site, and each node. If a node is disconnected or has an active alert, an icon appears next to the node name. If the node is connected and has no active alerts, no icon is shown.

|
When a node is not connected to the grid, such as during upgrade or a disconnected state, certain metrics might be unavailable or excluded from site and grid totals. After a node reconnects to the grid, wait several minutes for the values to stabilize. |

|
To change units for the storage values displayed in the Grid Manager, select the user drop-down in the upper right of the Grid Manager, then select User preferences. |
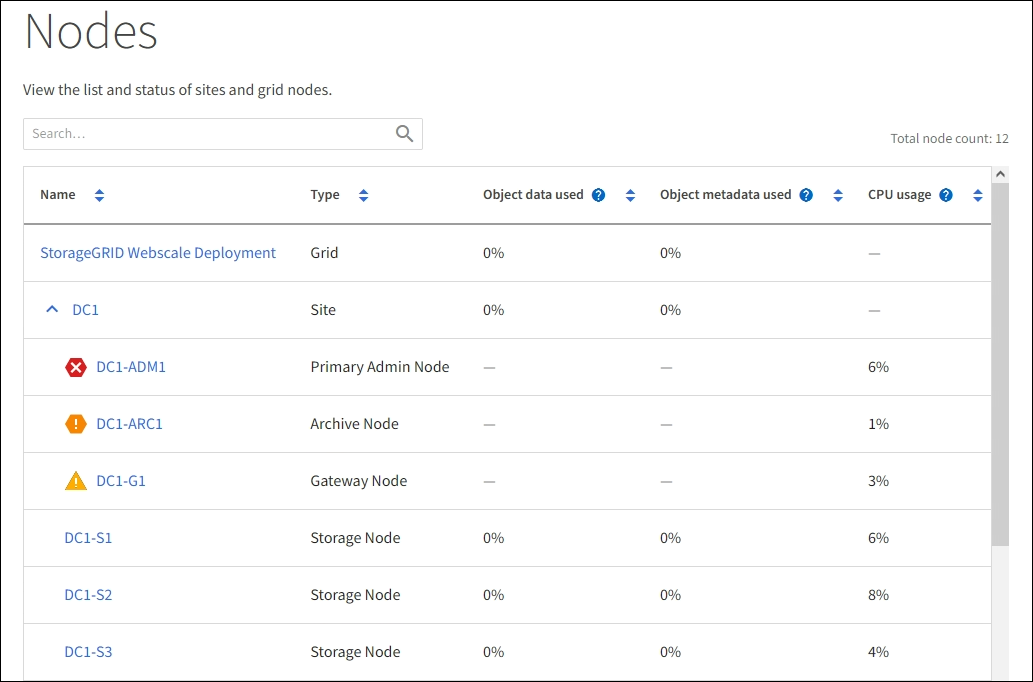
Connection state icons
If a node is disconnected from the grid, either of the following icons appears next to the node name.
| Icon | Description | Action required |
|---|---|---|
|
Not connected - Unknown For an unknown reason, a node is disconnected or services on the node are unexpectedly down. For example, a service on the node might be stopped, or the node might have lost its network connection because of a power failure or unexpected outage. The Unable to communicate with node alert might also be triggered. Other alerts might also be active. |
Requires immediate attention. Select each alert and follow the recommended actions. For example, you might need to restart a service that has stopped or restart the host for the node. Note: A node might appear as Unknown during managed shutdown operations. You can ignore the Unknown state in these cases. |
|
Not connected - Administratively down For an expected reason, node is not connected to grid. For example, the node, or services on the node, has been gracefully shut down, the node is rebooting, or the software is being upgraded. One or more alerts might also be active. Based on the underlying issue, these nodes often go back online with no intervention. |
Determine if any alerts are affecting this node. If one or more alerts are active, Select each alert and follow the recommended actions. |
If a node is disconnected from the grid, it might have an underlying alert, but only the “Not connected” icon appears. To see the active alerts for a node, select the node.
Alert icons
If there is an active alert for a node, one of the following icons appears next to the node name:
![]() Critical: An abnormal condition exists that has stopped the normal operations of a StorageGRID node or service. You must address the underlying issue immediately. Service disruption and loss of data might result if the issue is not resolved.
Critical: An abnormal condition exists that has stopped the normal operations of a StorageGRID node or service. You must address the underlying issue immediately. Service disruption and loss of data might result if the issue is not resolved.
![]() Major: An abnormal condition exists that is either affecting current operations or approaching the threshold for a critical alert. You should investigate major alerts and address any underlying issues to ensure that the abnormal condition does not stop the normal operation of a StorageGRID node or service.
Major: An abnormal condition exists that is either affecting current operations or approaching the threshold for a critical alert. You should investigate major alerts and address any underlying issues to ensure that the abnormal condition does not stop the normal operation of a StorageGRID node or service.
![]() Minor: The system is operating normally, but an abnormal condition exists that could affect the system's ability to operate if it continues. You should monitor and resolve minor alerts that don't clear on their own to ensure they don't result in a more serious problem.
Minor: The system is operating normally, but an abnormal condition exists that could affect the system's ability to operate if it continues. You should monitor and resolve minor alerts that don't clear on their own to ensure they don't result in a more serious problem.
View details for a system, site, or node
To filter the information shown in the Nodes table, enter a search string in the Search field. You can search by system name, display name, or type (for example, enter gat to quickly locate all Gateway Nodes).
To view the information for the grid, site, or node:
-
Select the grid name to see an aggregate summary of the statistics for your entire StorageGRID system.
-
Select a specific data center site to see an aggregate summary of the statistics for all nodes at that site.
-
Select a specific node to view detailed information for that node.