

Monitor MetroCluster configurations
 Suggest changes
You can monitor connectivity issues in your MetroCluster configuration. The details include the status of the components and connectivity within a cluster and the connectivity status between the clusters in the MetroCluster configuration. Here, you will get to know how to monitor connectivity issues in clusters protected by MetroCluster over FC and MetroCluster over IP configurations.
You can monitor the MetroCluster configurations from the following views from the Active IQ Unified Manager left navigation pane:
-
Storage > Clusters > Protection: MetroCluster view
-
Protection > Relationships > Relationship: MetroCluster view
Unified Manager uses system health alerts to indicate the status of the components and connectivity in the MetroCluster configuration.
-
Both the local and remote clusters in a MetroCluster configuration must be added to Active IQ Unified Manager.
-
In a MetroCluster over IP configuration, if a Mediator is to be supported, the Mediator should be configured and added to the cluster by corresponding API.
-
You must have the Operator, Application Administrator, or Storage Administrator role.
Monitor connectivity issues in MetroCluster over FC configuration
For clusters in a MetroCluster over FC configuration, the connectivity charts are displayed on the Cluster / Health details page. Follow these steps.
-
In the left navigation pane, click Storage > Clusters.
A list of all of the monitored clusters is displayed.
-
From the Protection: MetroCluster view, click the name of the cluster for which you want to view MetroCluster over FC configuration details. Alternately, you can filter by clusters in a MetroCluster configuration.
-
In the Cluster / Health details page, click the MetroCluster Connectivity tab. The MetroCluster Connectivity tab is available for only MetroCluster over FC configurations.
The topology of the MetroCluster configuration is displayed in the corresponding cluster object area. You can use the information displayed in the Cluster / Health details page to rectify any connectivity issues. For example, if the connectivity between the node and the switch in a cluster is down, the following icon is displayed:

If you move the pointer over the icon, you can view detailed information about the generated event.
If you discover connectivity issues in your MetroCluster configuration, you must log in to System Manager or access the ONTAP CLI to resolve the issues.
For more information about determining cluster health, see Determine cluster health in MetroCluster over FC configuration.
Monitor connectivity issues in MetroCluster over IP configuration
For clusters in a MetroCluster over IP configuration, the connectivity charts are displayed on the Clusters page. Follow these steps.
-
In the left navigation pane, click Storage > Clusters.
A list of all of the monitored clusters is displayed.
-
From the Protection: MetroClusters view, click the name of the cluster for which you want to view MetroCluster over IP configuration details. Alternately, you can filter by clusters in a MetroCluster configuration.
-
Expand the row by clicking the caret
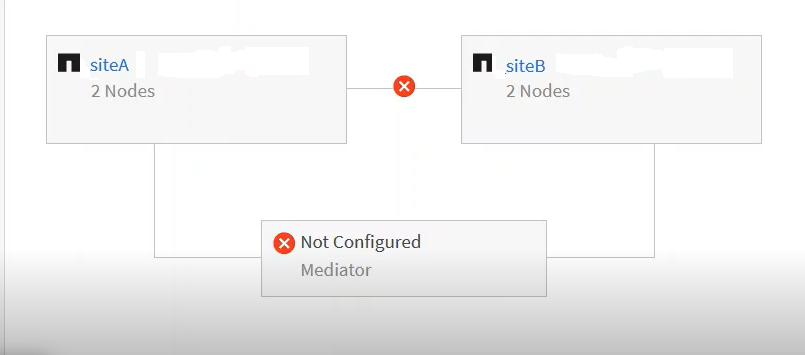
vicon. The caret icon appears for only a cluster that this protected by MetroCluster over IP configuration.You can view the topology of the source and mirror sites, as well as the Mediator, if any, used for the connection. You can view the following information:
-
Connectivity across the sites
-
Health and availability issues, if any, on both the sites
-
Mediator-related issues
-
Replication related issues.

The following statuses are reported: Critical (  ), Error (
 ), or Normal (
 ). You can also view the aggregate data replication status of the primary and mirror data in the same topology.
In the following diagram, you can see that the intersite connectivity between the source and destination clusters is unavailable, and the Mediator between them is not configured.
-
-
Click the status icon. A message with the error definition is displayed. If an event has been raised for the issue in your MetroCluster over IP configuration, you can click the View Event button on the message and view the event details. When you have resolved the issue and the event, the status icon in this topology turns to normal (
). -
You can view further configuration details in the MetroCluster Overview and Protection sections on the Configuration tab of the Cluster / Health details page.
|
|
Only for a MetroCluster over IP configuration, you can have view the cluster topology on the Clusters page. For clusters in a MetroCluster over FC configuration, the topology is displayed on the MetroCluster Connectivity tab on the Cluster / Health details page. |
Related information
-
For information about Relationship:MetroCluster view, see Monitor MetroCluster configurations.
-
For information about Relationship: Last 1 month Transfer Status view, see Relationship: Last 1 month Transfer Status view.
-
For information about Relationship: Last 1 month Transfer Rate view, see Relationship: Last 1 month Transfer Rate view.
-
For information about Relationship: All Relationships view, see Relationship: All Relationships view.