

View metrics on the NetApp Console Home page
 Suggest changes
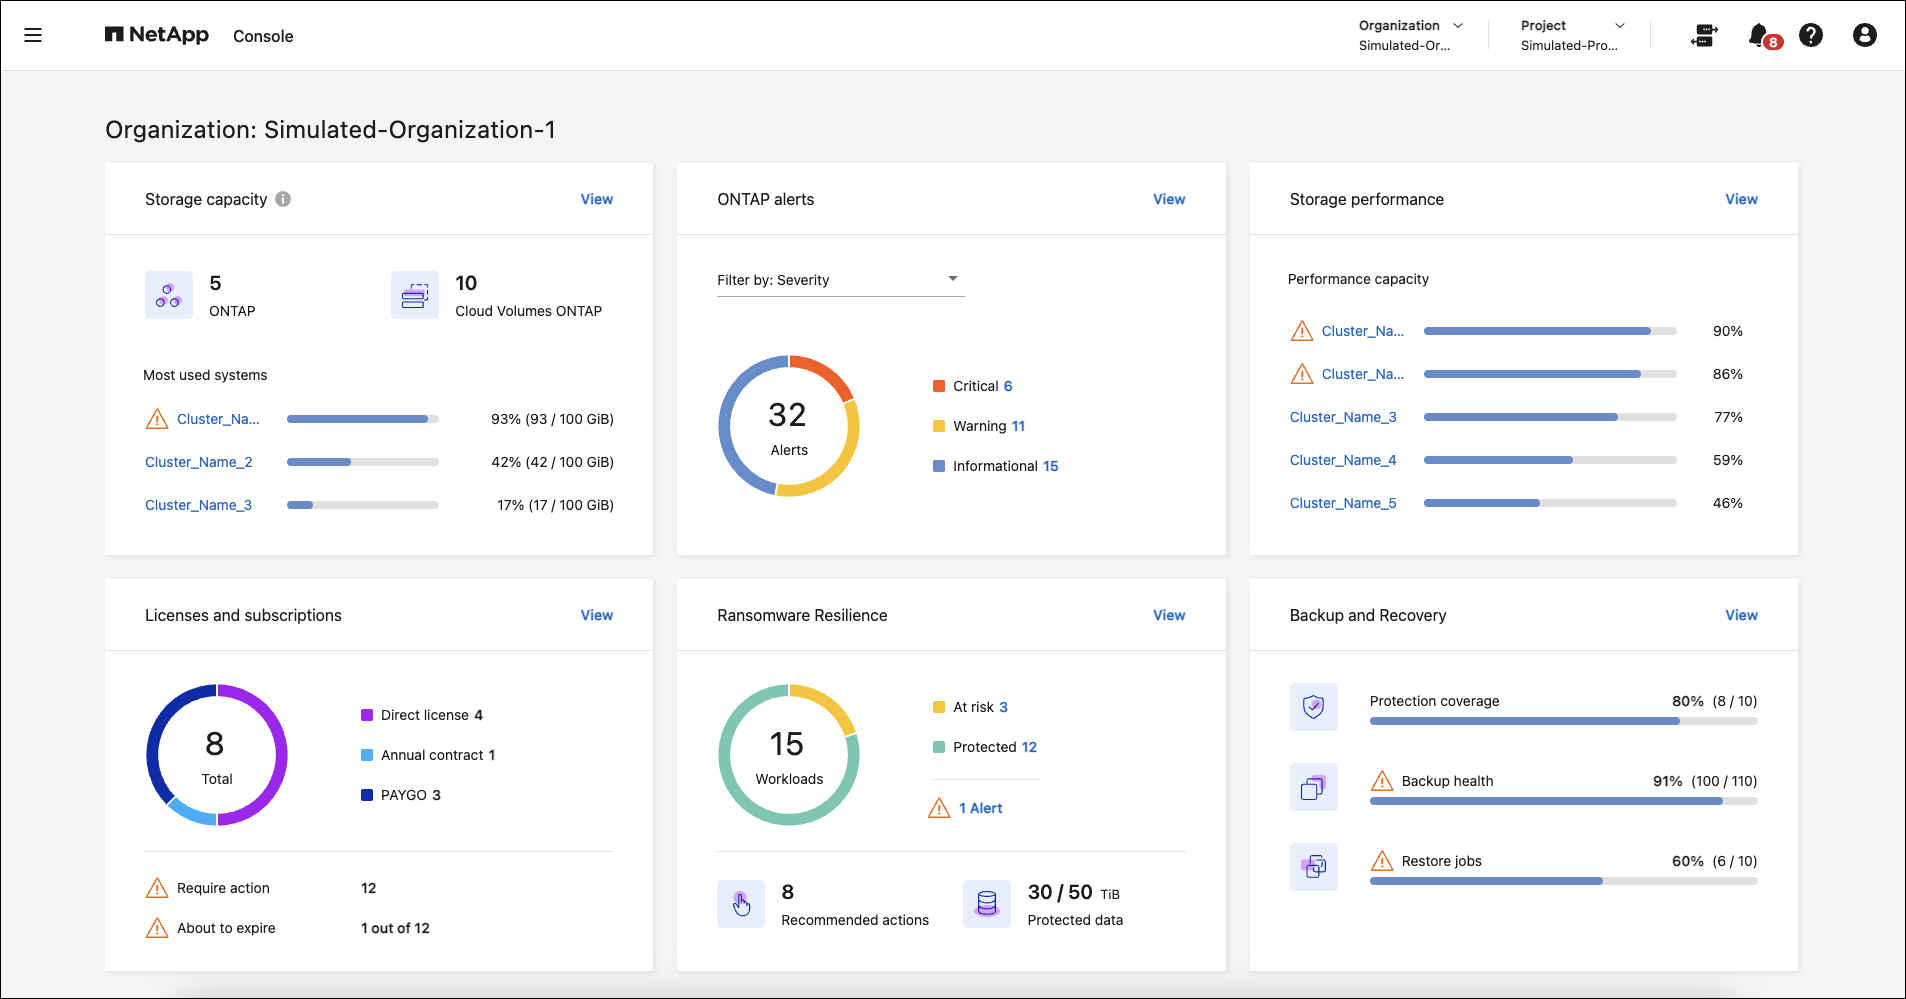
Monitoring the health of your storage estate ensures that you are aware of issues with storage protection and can take steps to resolve them. Using the NetApp Console Home page, view a status of your backups and restores from NetApp Backup and Recovery and the number of workloads that are at risk for a ransomware attack or protected as indicated by NetApp Ransomware Resilience. You can review the storage capacity for individual clusters and Cloud Volumes ONTAP, ONTAP alerts, storage performance capacity per cluster or Cloud Volumes ONTAP system, the different types of licenses you have, and more.
All panes on the Home page show data at the organization level. The Storage capacity and Storage performance panes show systems associated with projects that the user can access based on IAM permissions.
The system refreshes the data on the Home page every five minutes. Caching may cause the data on this page to differ from real values for up to 15 minutes.

|
Accurate metrics on the Home page require appropriately sized and configured Console agents. |
Required NetApp Console roles
Each pane in the Home page requires different user roles:
-
Storage capacity pane: Ability to see the NetApp Console Systems page
-
ONTAP alerts pane: Folder or project admin, Operations Support Analyst, Organization admin, Organization viewer, Super admin, Super viewer
-
Storage performance capacity pane: Ability to see the NetApp Console Systems page
-
Licenses and subscriptions pane: Folder or project admin, Organization admin, Organization viewer, Super admin, Super viewer
-
Ransomware Resilience pane: Folder or project admin, Organization admin, Ransomware Resilience admin, Ransomware Resilience viewer, Super admin, Super viewer
-
Backup and Recovery pane: Backup and recovery backup admin, Backup and recovery super admin, Backup and recovery backup viewer, Backup and recovery clone admin, Folder or project admin, Organization admin, Backup and recovery restore admin, Super admin, Super viewer
If you do not have permissions to access a pane, the pane displays a message indicating you lack permissions to use it.
-
From the NetApp Console menu, select Home.
If you have the Organization admin role and no agent or storage systems are set up, the Home page displays getting started information.
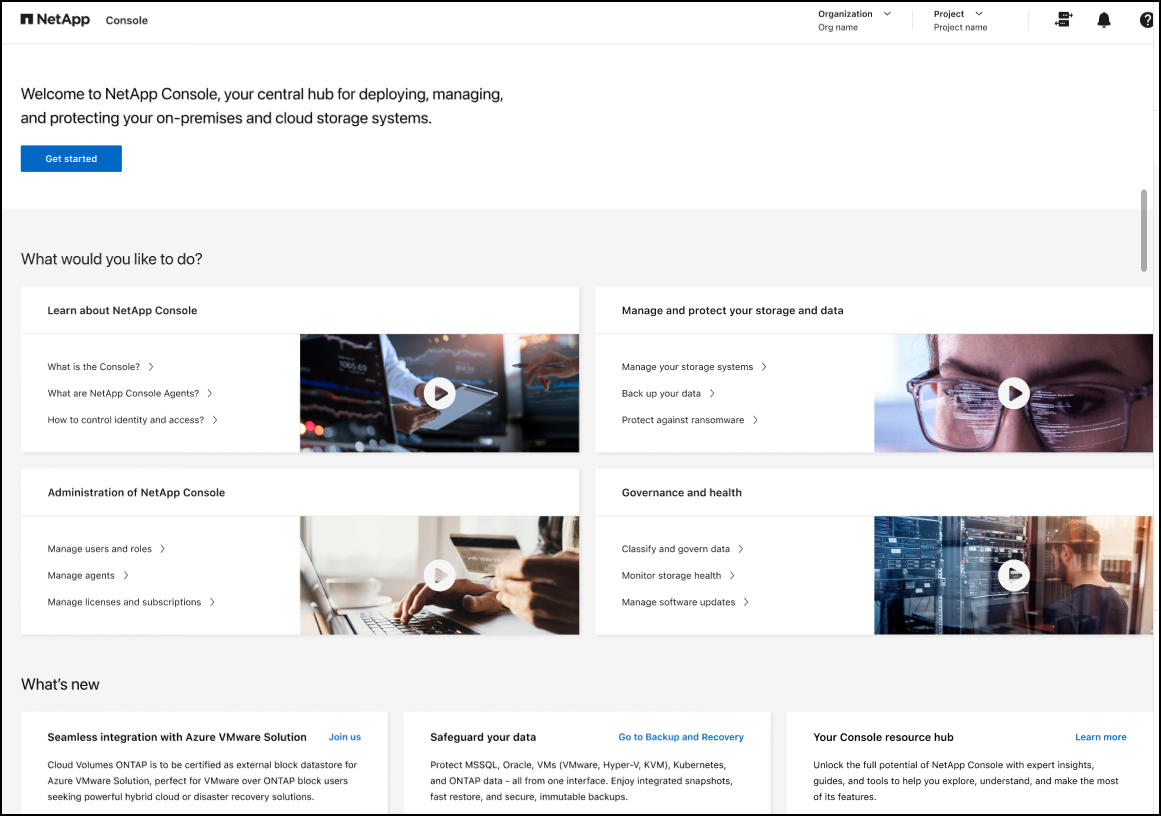
If you already set up the NetApp Console, at least one Console agent is enabled, and at least one cluster or Cloud Volumes ONTAP system has been added on that agent, the Home page shows metrics about your storage environment.
Enable metrics to appear on the Home page
You can see metrics on the Home page when the following conditions are met:
-
You are logged into a SaaS instance of the NetApp Console.
-
You belong to an organization with existing storage resources (agent and cluster or Cloud Volumes ONTAP system).
-
At least one Console agent is enabled.
-
At least one cluster or Cloud Volumes ONTAP system has been added on that agent.
To enable metrics to appear on the Home page, complete the following tasks:
-
Enable at least one Console agent.
-
Add at least one cluster or one Cloud Volumes ONTAP using that agent.
View the overall storage capacity
The Storage capacity pane provides the following information across ONTAP clusters and Cloud Volumes ONTAP systems:
-
Number of ONTAP systems discovered in the Console
-
Number of Cloud Volumes ONTAP systems discovered in the Console
-
Capacity usage per cluster
The order of the clusters or Cloud Volumes ONTAP systems is based on the amount of capacity used. The cluster or system with the highest capacity appears first for easy identification.
Warning indicators show for clusters at 80% capacity, with data updating every five minutes.

|
If you have multiple projects, you might see different data in the Storage capacity pane compared to the Systems page. This is because the Systems page shows information based on the project level, whereas the Storage capacity pane shows information at the organization level. Also, the data on this pane might differ from real values for a maximum of 15 minutes because the data is cached for that duration to optimize performance. |
-
From the NetApp Console menu, review the Storage capacity pane.
-
In the Storage capacity pane, select View to go to the Console Systems page.
-
On the Systems page, select the project containing the cluster you want to view.
-
On the Systems page, select a cluster to view more details about that cluster.
View ONTAP alerts
View issues or potential risks in your NetApp on-premises ONTAP environments. You can see some non-EMS alerts and some EMS alerts.
The data updates every 5 minutes.
You can see ONTAP alerts with these severities:
-
Critical
-
Warning
-
Informational
You can see ONTAP alerts for these impact areas:
-
Capacity
-
Performance
-
Protection
-
Availability
-
Security
|
|
Caching optimizes performance, but may cause the data on this pane to differ from actual values for up to 15 minutes. |
Systems supported
-
An on-premises ONTAP NAS or SAN system is supported.
-
Cloud Volumes ONTAP systems are not supported.
Data sources supported
View alerts regarding certain events that occur in ONTAP. They are a combination of EMS and metric-based alerts.
For details about ONTAP alerts, refer to About ONTAP alerts.
For a list of alerts that you might see, refer to View potential risks in ONTAP storage.
-
From the NetApp Console menu, review the ONTAP alerts pane.
-
Optionally, filter the alerts by selecting the severity level or change the filter to show alerts based on impact area.
-
In the ONTAP alerts pane, select View to go to the Console Alerts page.
View storage performance capacity
Review the storage performance capacity used per cluster or Cloud Volumes ONTAP system to determine how performance capacity, latency, and IOPS are impacting your workloads. For example, you might find that you need to shift workloads to minimize latency and maximize IOPS and throughput for your critical workloads.
The system arranges clusters and systems by performance capacity, listing the highest capacity first for easy identification.
|
|
Caching optimizes performance, but may cause the data on this pane to differ from actual values for up to 15 minutes. |
-
From the NetApp Console menu, review the Storage performance pane.
-
In the Storage performance pane, select View to go to a Performance page that lists all the clusters and Cloud Volumes ONTAP systems data for performance capacity, IOPS, and latency.
-
Select a cluster to view its details in System Manager.
View the licenses and subscriptions that you have
Review the following information on the Licenses and subscriptions pane:
-
The total number of licenses and subscriptions that you have.
-
The number of each type of license and subscription that you have (direct license, annual contract, or PAYGO).
-
The number of licenses and subscriptions that are active, require action, or nearing expiration.
-
The system displays indicators next to the license types that require action or are nearing expiration.
The data refreshes every 5 minutes.
|
|
Caching optimizes performance, but may cause the data on this pane to differ from actual values for up to 15 minutes. |
-
From the NetApp Console menu, review the Licenses and subscriptions pane.
-
In the Licenses and subscriptions pane, select View to go to the Console Licenses and subscriptions page.
View Ransomware Resilience status
Find out if workloads are at risk of ransomware attacks or protected with the NetApp Ransomware Resilience data service. You can review the total amount of data that is protected, view the number of recommended actions, and view the number of alerts related to ransomware protection.
The data refreshes every 5 minutes and matches the data shown in the NetApp Ransomware Resilience Dashboard.
-
From the NetApp Console menu, review the Ransomware Resilience pane.
-
Do one of the following in the Ransomware Resilience pane:
-
Select View to go to the NetApp Ransomware Resilience Dashboard. For details, refer to Monitor workload health using the NetApp Ransomware Resilience Dashboard.
-
Review "Recommended actions" in the NetApp Ransomware Resilience Dashboard. For details, refer to Review protection recommendations on the NetApp Ransomware Resilience Dashboard.
-
Select the alerts link to review alerts in NetApp Ransomware Resilience Alerts page. For details, refer Handle detected ransomware alerts with NetApp Ransomware Resilience.
-
View Backup and Recovery status
Review the overall status of your backups and restores from NetApp Backup and Recovery. You can see the number of protected and unprotected resources. You can also see the percentage of backups and restore operations for protection of your workloads. A higher percentage indicates improved data protection.
The data refreshes every 5 minutes.
|
|
Caching optimizes performance, but may cause the data on this pane to differ from actual values for up to 15 minutes. |
-
From the NetApp Console menu, review the Backup and Recovery pane.
-
Select View to go to the NetApp Backup and Recovery Dashboard. For details, refer to NetApp Backup and Recovery documentation.