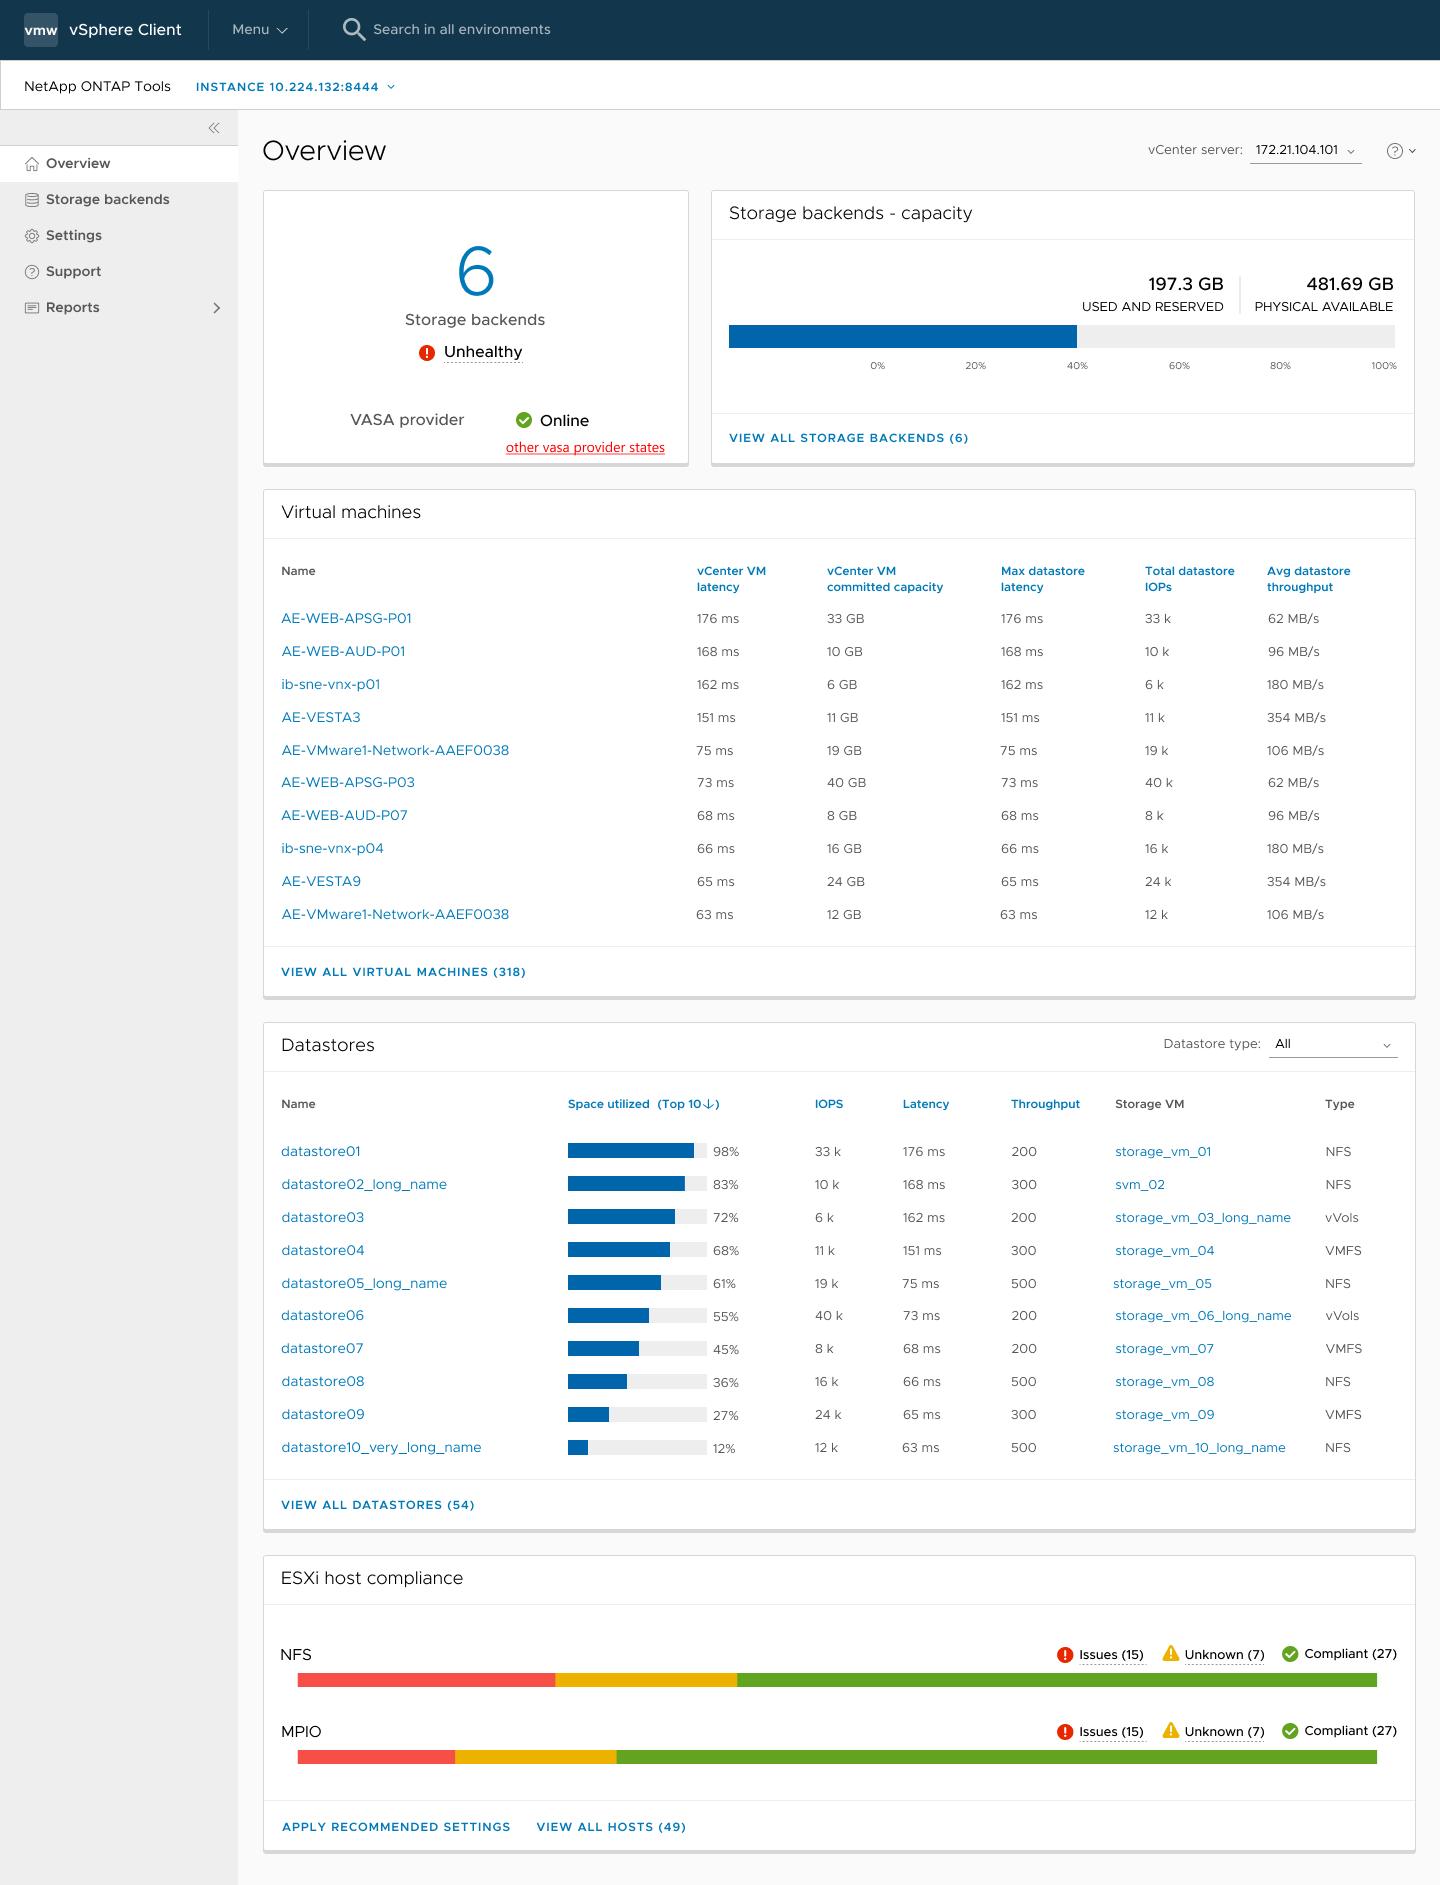
NetApp ONTAP tools for VMware vSphere plug-in Dashboard overview
 Suggest changes


When you select the NetApp ONTAP tools for VMware vSphere plug-in icon in the shortcuts section on the vCenter client, the user interface navigates to the overview page. This page acts like the dashboard providing you the summary of the ONTAP tools for VMware vSphere plug-in.
In the case of Enhanced Linked Mode setup (ELM), the vCenter Server select dropdown appears and you can select a desired vCenter Server to see the data relevant to it. This dropdown is available for all the other listing views of the plugin.
vCenter Server selection made in one page persists across the tabs of the plug-in.

The dashboard has several cards showing different elements of the system. The following table shows the different cards and what they represent.
Card name |
Description |
Status |
The Status card shows the number of storage backends added and the overall health status of storage backends and VASA Provider status of a vCenter. Storage backends status shows as "Healthy" when all the storage backends status is normal. Storage backends status shows as "Unhealthy" if any one of the storage backends have an issue (Unknown/Unreachable/Degraded status). When you click on the "Unhealthy" status, a tool tip opens with the status of the storage backends. You can click on any storage backend for more details. Other VASA Provider (VP) states link shows the current state of the VP that is registered in the vCenter Server. |
Storage Backends - Capacity |
This card shows the aggregated used and available capacity of all storage backends for the selected vCenter Server instance. |
Virtual machines |
This card shows the top 10 VMs sorted by performance metric. You can click on the header to get the top 10 VMs for the selected metric sorted by either ascending or descending order. The sorting and filtering changes made on the card persists until you change or clear the browser cache. |
Datastores |
This card shows the Top 10 datastores sorted by a performance metric. You can click on the header to get the top 10 datastores for the selected metric sorted by either ascending or descending order. The sorting and filtering changes made on the card persists until you change or clear the browser cache. There is a Datastore type drop-down to select the type of the datastores - NFS, VMFS, or vVols. |
ESXi Host compliance card |
This card shows overall compliance status of all ESXi Hosts (for the selected vCenter) settings with respect to the recommended NetApp host settings by settings group/category. You can click on Apply Recommended Settings link to apply the recommended settings. You can click on issues/unknown to see the list of hosts. |


