

Learn about the ONTAP tools dashboard
 Suggest changes
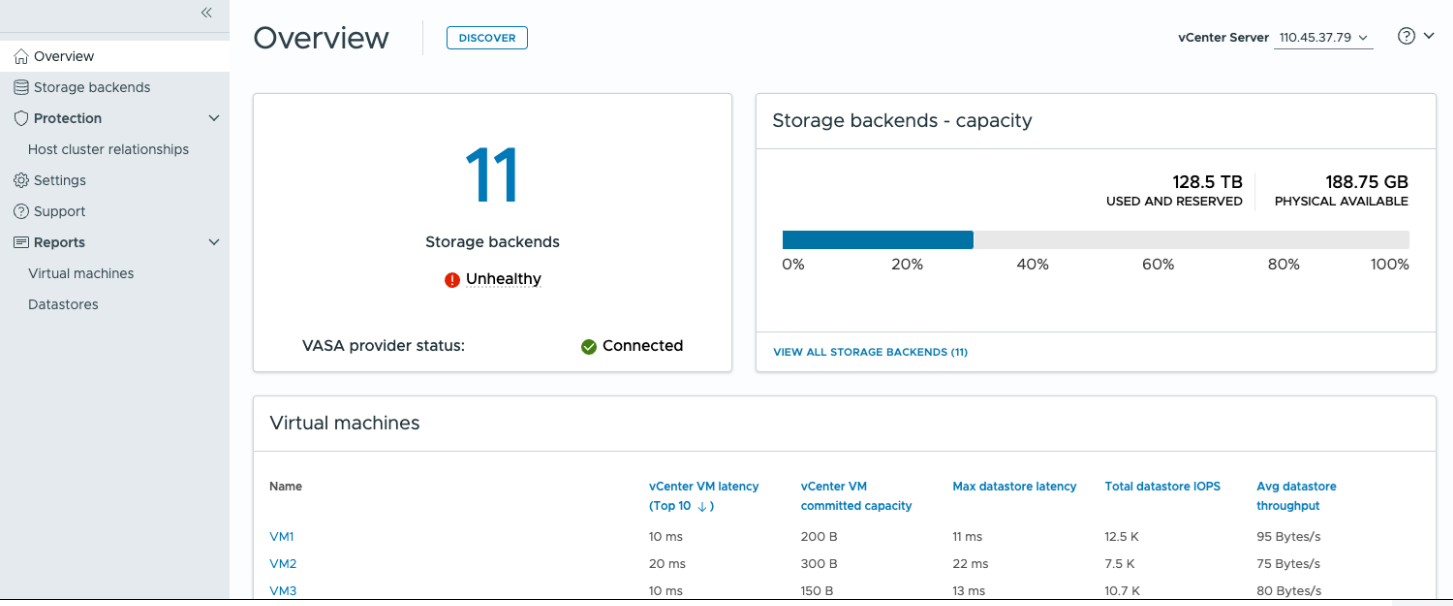
Selecting the ONTAP tools for VMware vSphere plug-in icon from the shortcuts section in the vCenter client opens the overview page. This dashboard provides a summary of the ONTAP tools for VMware vSphere plug-in.
In Enhanced Linked Mode (ELM), the vCenter Server dropdown appears. Choose a vCenter Server to view its data. The dropdown is available in all listing views of the plug-in.
When you select a vCenter Server on one page, it stays the same when you switch tabs in the plug-in.
From the overview page, you can run the Discovery action. The discovery action detects newly added or updated storage backends, hosts, datastores, and protection status or relationships at the vCenter level. Run on-demand discovery without waiting for the scheduled discovery.
If you add a new host to a protected host cluster, the protection settings change to Partially protected.
To resolve this state, open Modify cluster configuration, assign the host to the correct site (source or target), and select Modify.

|
The Discovery button is enabled only if you have the required privilege to perform discovery. |
After the discovery request is submitted, you can track the progress of the action in the recent tasks panel.
The dashboard has several cards showing different elements of the system. The following table shows the different cards and what they represent.
Card |
Description |
Status |
The Status card shows the number of storage backends and the overall health status of the storage backends and the VASA Provider. Storage backends status shows Healthy when all storage backend statuses are normal and shows Unhealthy if any storage backend has an issue (Unknown/Unreachable/Degraded status). Select the tool tip to open the status details of the storage backends. You can select any storage backend for more details. Other VASA Provider states link shows the current state of the VASA Provider that is registered in the vCenter Server. |
Storage Backends - Capacity |
This card shows the aggregated used and available capacity of all storage backends for the selected vCenter Server instance. For ASA r2 storage systems, the capacity data is not shown because storage is disaggregated. |
Virtual machines |
This card shows the top 10 VMs sorted by performance metric. You can select the header to get the top 10 VMs for the selected metric sorted by either ascending or descending order. The sorting and filtering changes made on the card persists until you change or clear the browser cache. |
Datastores |
This card shows the top 10 datastores sorted by a performance metric. You can select the header to get the top 10 datastores for the selected metric sorted by either ascending or descending order. The sorting and filtering changes made on the card persists until you change or clear the browser cache. There is a Datastore type drop-down to select the type of the datastores - NFS, VMFS, or vVols. |
ESXi Host compliance card |
This card shows whether all ESXi hosts (for the selected vCenter) follow the recommended NetApp host settings by group or category. You can select the Apply Recommended Settings link to apply the recommended settings. You can select the compliance status of the hosts to see the list of hosts. |